There’s a dearth of react-vis images online, which makes it difficult to get a sense of the full breadth and depth of available react-vis components.
So I made this gallery of screenshots covering examples from the official documentation and other sources.
I generated most of the images in this gallery using storycap applied to a locally-built version of the react-vis Storybook.
If you don’t want to build react-vis locally, you can run storycap on a public hosted instance of the react-vis Storybook:
npx storycap https://uber.github.io/react-vis/website/dist/storybook
The remaining images and videos were captured by hand from the react-vis docs and showcase.
This page is quite long, and not designed for readability - my purpose is twofold:
- to catalogue these images in Ghosty
- to get this page indexed by the search engines
Contents
- Contents
- Manually-captured components from the docs & showcase
- ArcSeries
- ContourSeries
- HeatmapSeries
- HexbinSeries
- WhiskerSeries
- ParallelCoordinates
- Flexible plots
- DecorativeAxis
- CustomSVGSeries
- LabelSeries
- LineMarkSeries
- MarkSeries
- VerticalBarSeries
- PolygonSeries
- Zooming
- Brushing
- Animation effects
- Sankey diagram
- Treemap
- RadarChart
- Polygon
- Voronoi diagrams / regions
- Axes
- Candlestick
- Circular (radial) gridlines
- Force-directed graph
- Crosshair
- Custom SVG
- Tooltips / Hint
- Line series
- Horizontal & Vertical bar series
- Horizontal & Vertical RectSeries
- Mark series
- Borders
- Misc.
- Scales
- Axis formatting
- VerticalBarSeries
- Pie chart
- MarkSeries
- LineSeries
- AreaSeries
- HorizontalBarSeries
- Legends
Manually-captured components from the docs & showcase
There are several react-vis components that aren’t part of the official Storybook, so we can’t extract screenshots of those programmatically via storycap.
Below are manually-captured screenshots of (most of) those components.
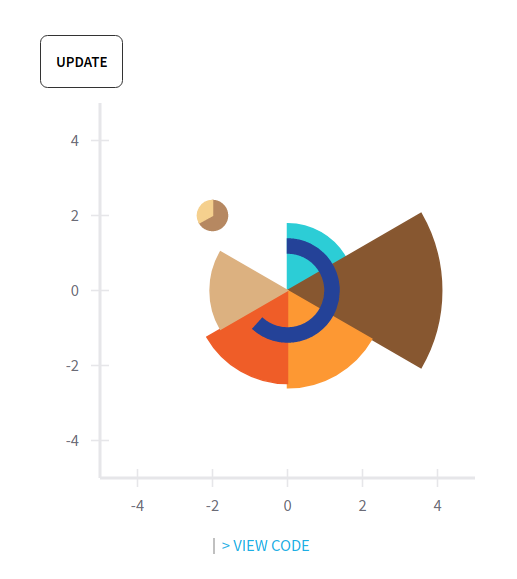
ArcSeries
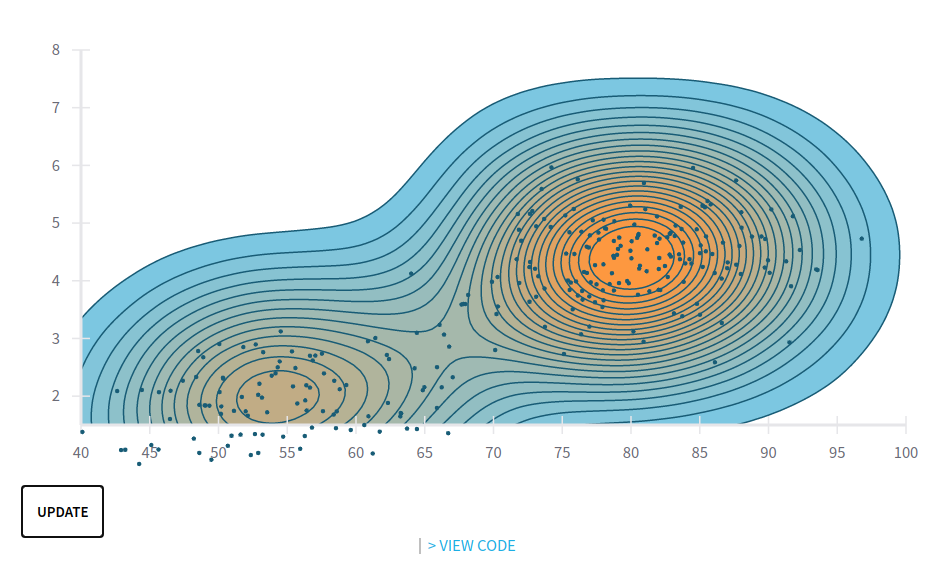
ContourSeries
Animatable contour plot, with tweening
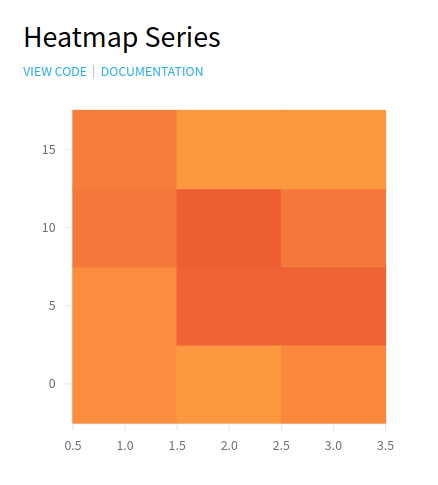
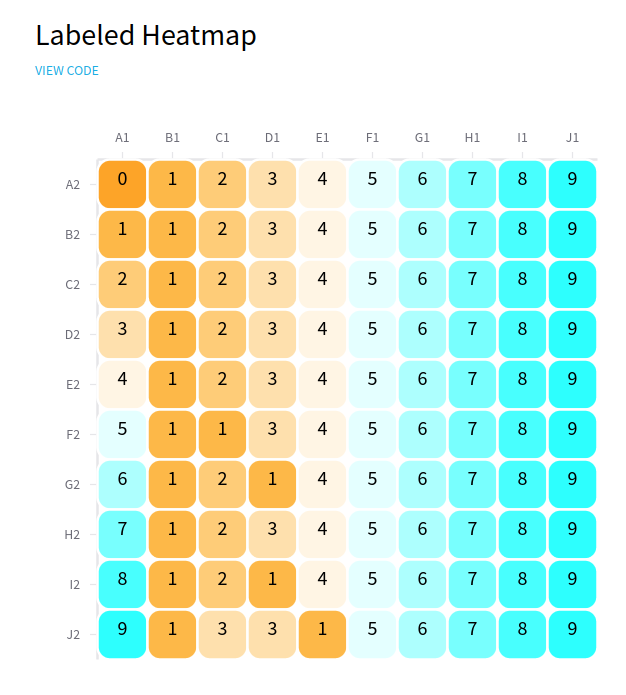
HeatmapSeries
Heatmap series
Heatmap with overlaid labels
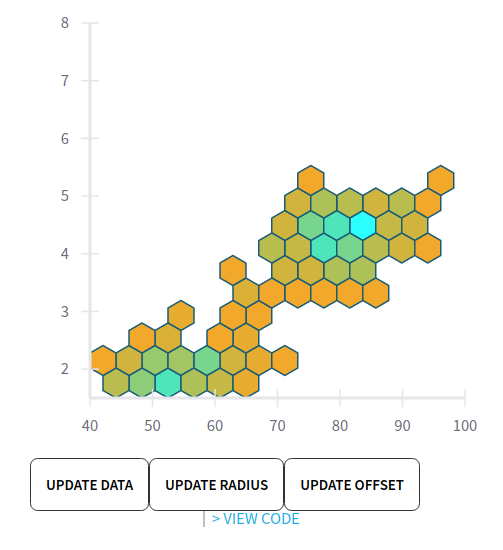
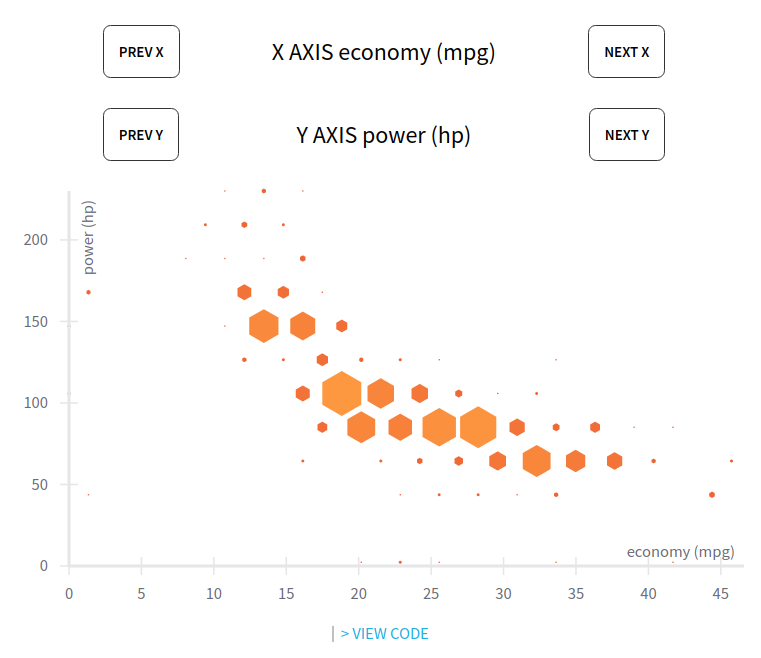
HexbinSeries
Aggregates data into 2D hexagonal bins.
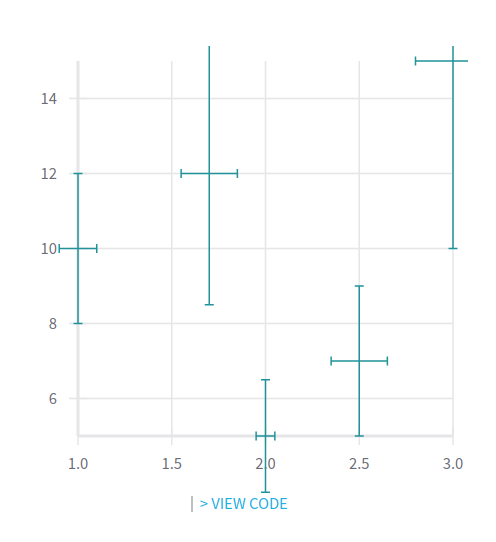
WhiskerSeries
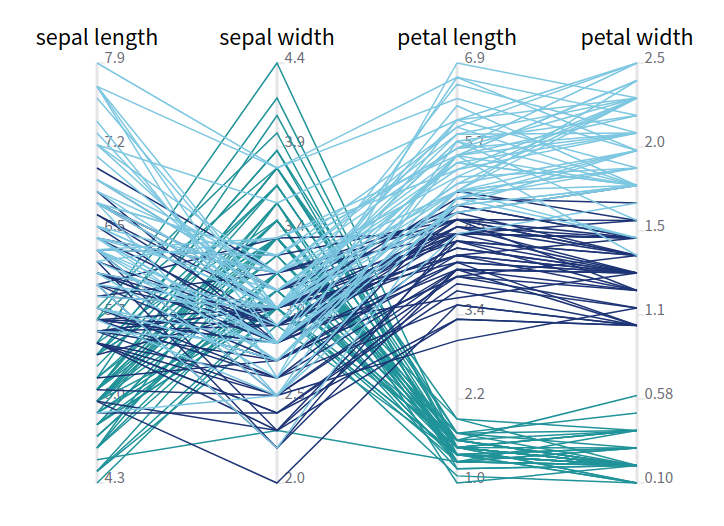
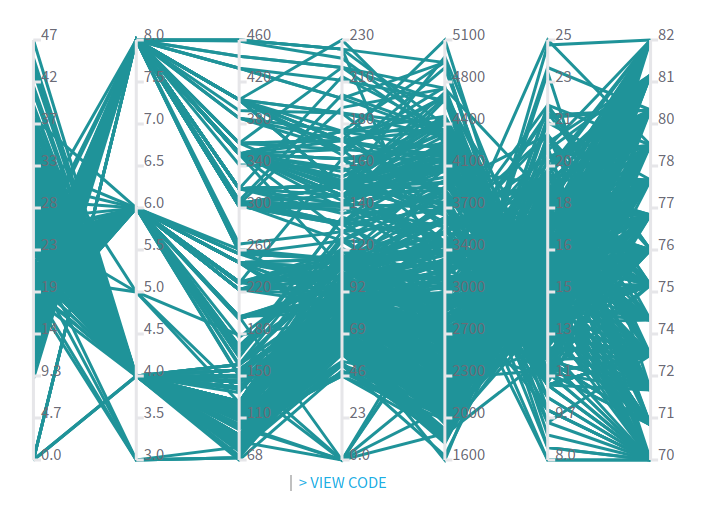
ParallelCoordinates
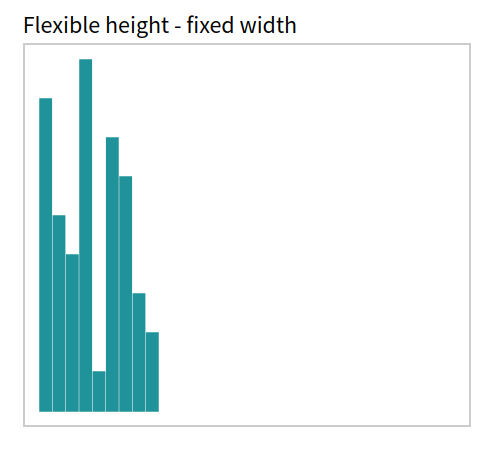
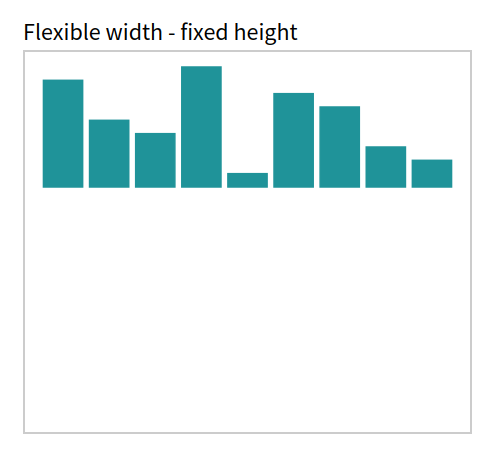
Flexible plots
FlexibleHeightXYPlot: fixed width, flexible height
FlexibleWidthXYPlot: flexible width, fixed height
FlexibleXYPlot: flexible width & height

DecorativeAxis
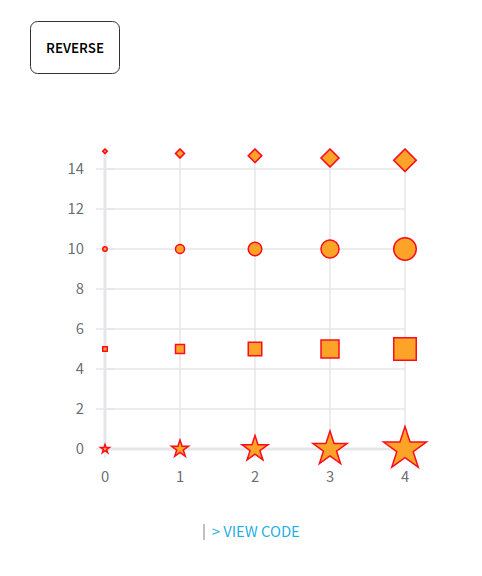
CustomSVGSeries
Custom SVG mark shapes
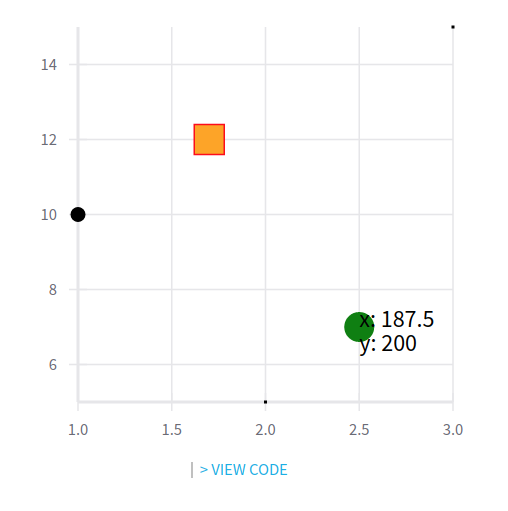
Custom SVG mark shapes: star, diamond, circle, square
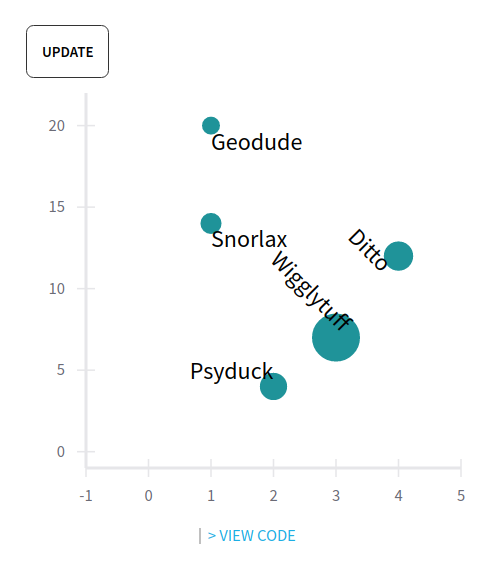
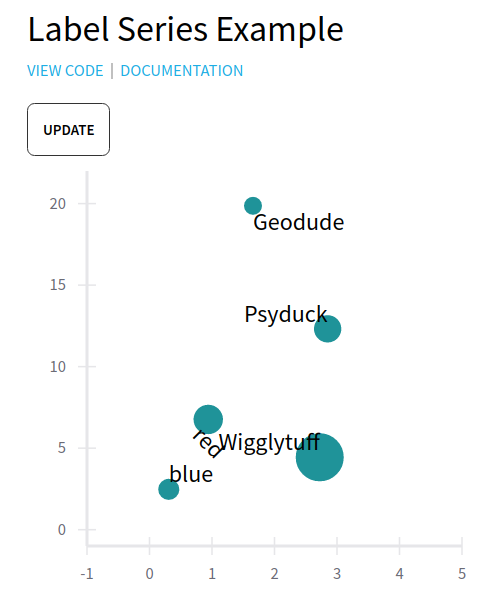
LabelSeries
Labeled scatter plot (of Pokemon)
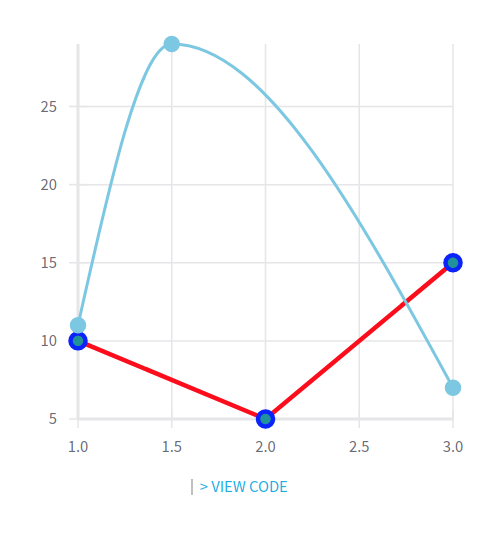
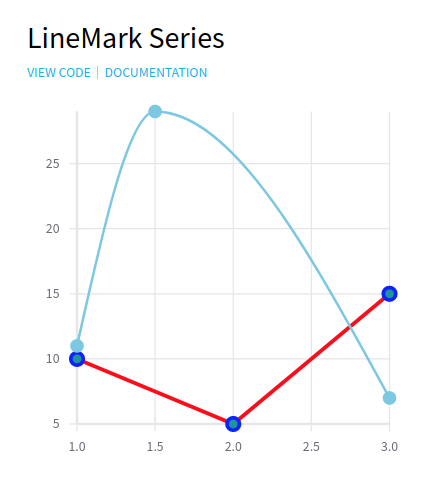
LineMarkSeries
Line chart with a “mark” for each data point
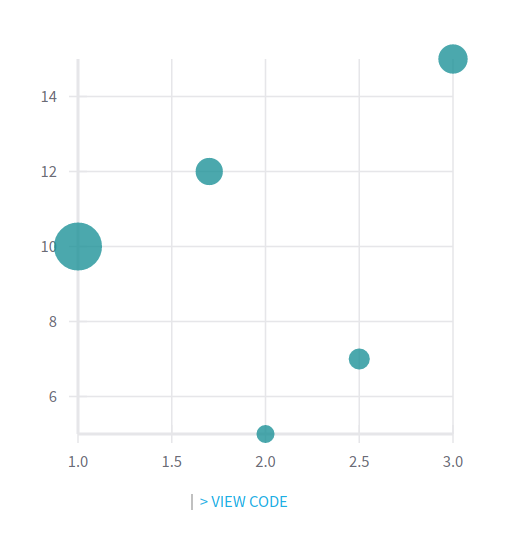
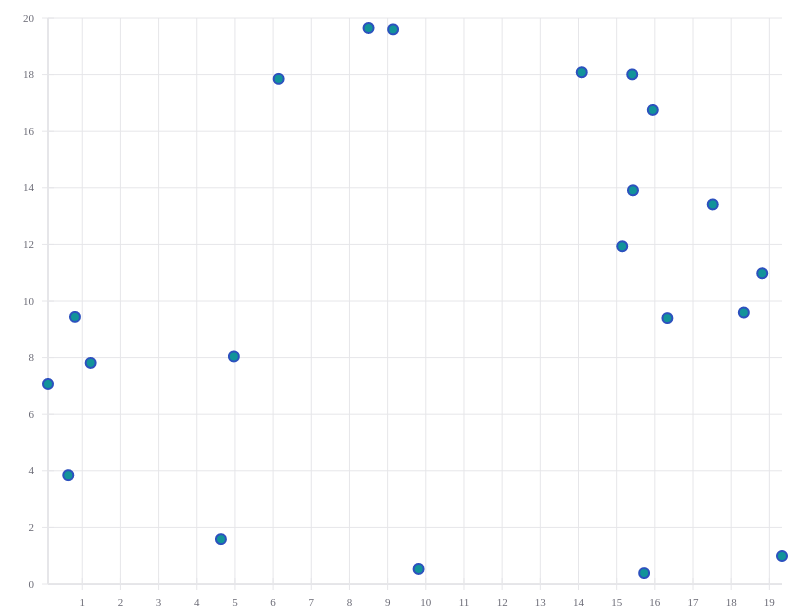
MarkSeries
A scatter plot
VerticalBarSeries
VerticalBarSeries, cluster
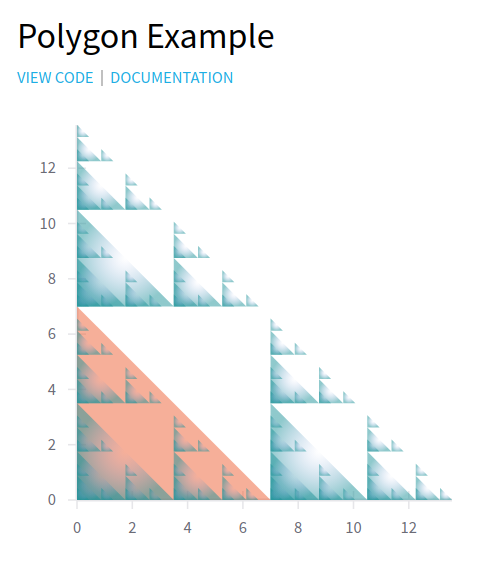
PolygonSeries
Zooming
Zoom in via mouse selection
Brushing
Draggable 2D brush
Draggable 1D brush
1D brush over scatter plot
Animation effects
Gentle
No wobble
Stiff
Wobbly
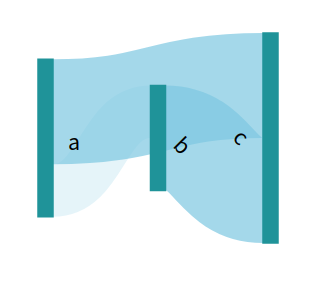
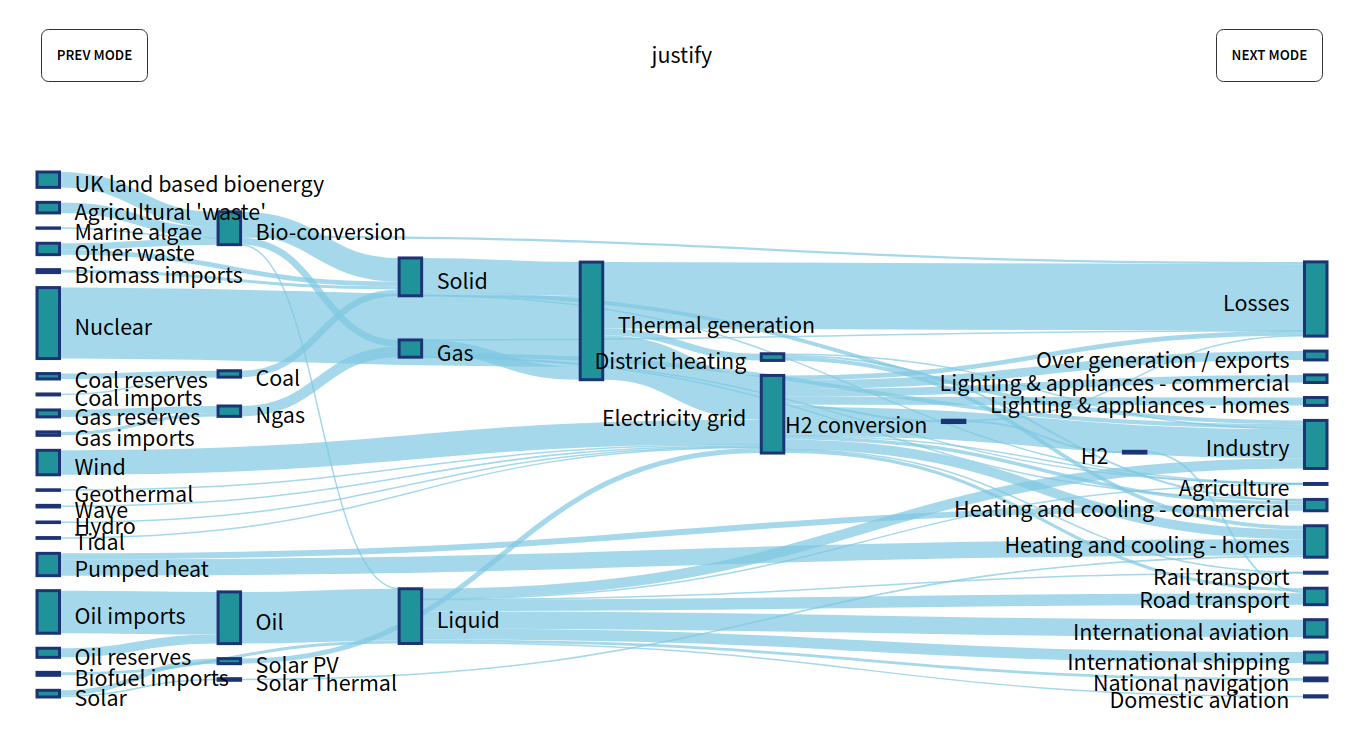
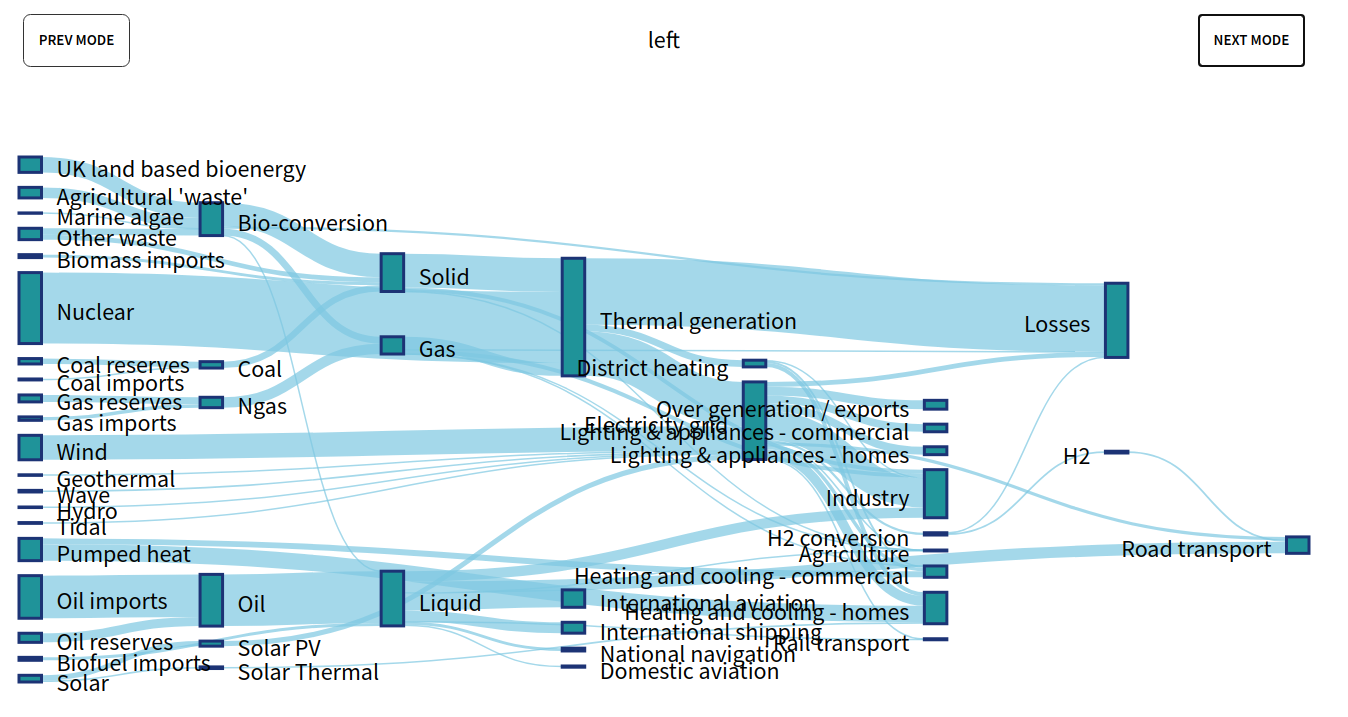
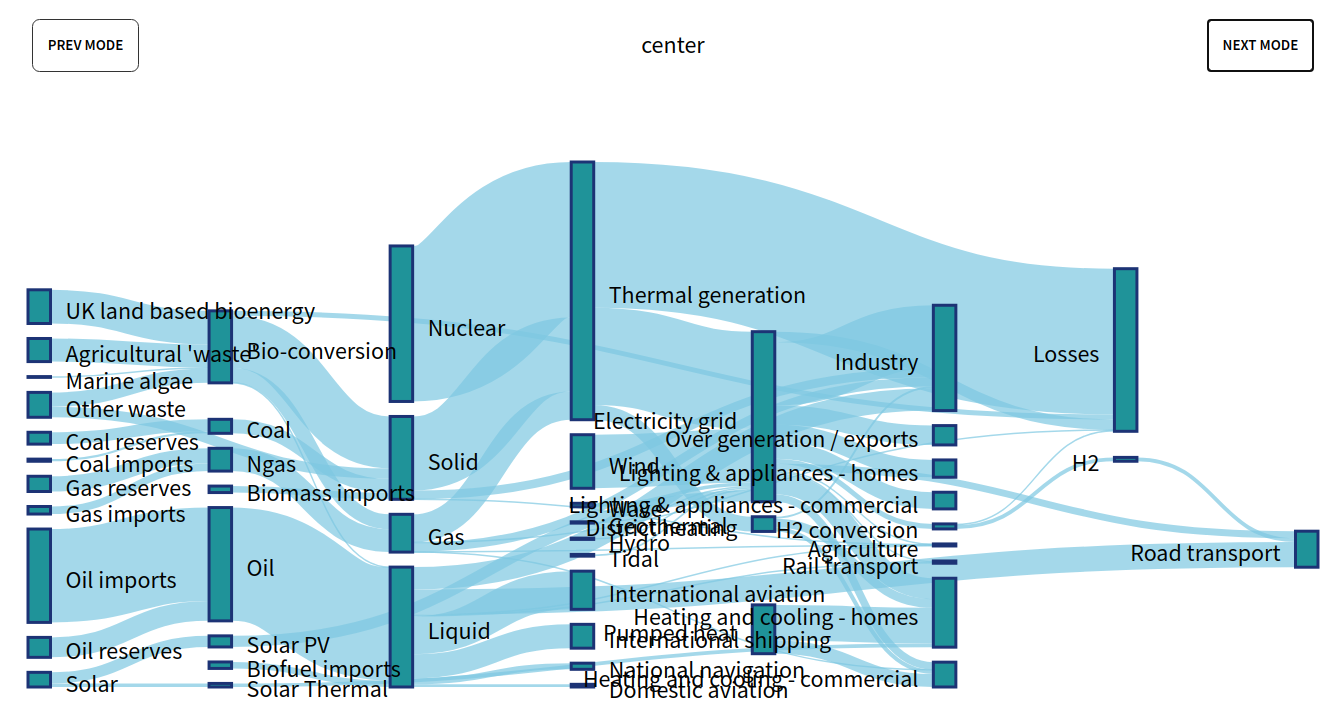
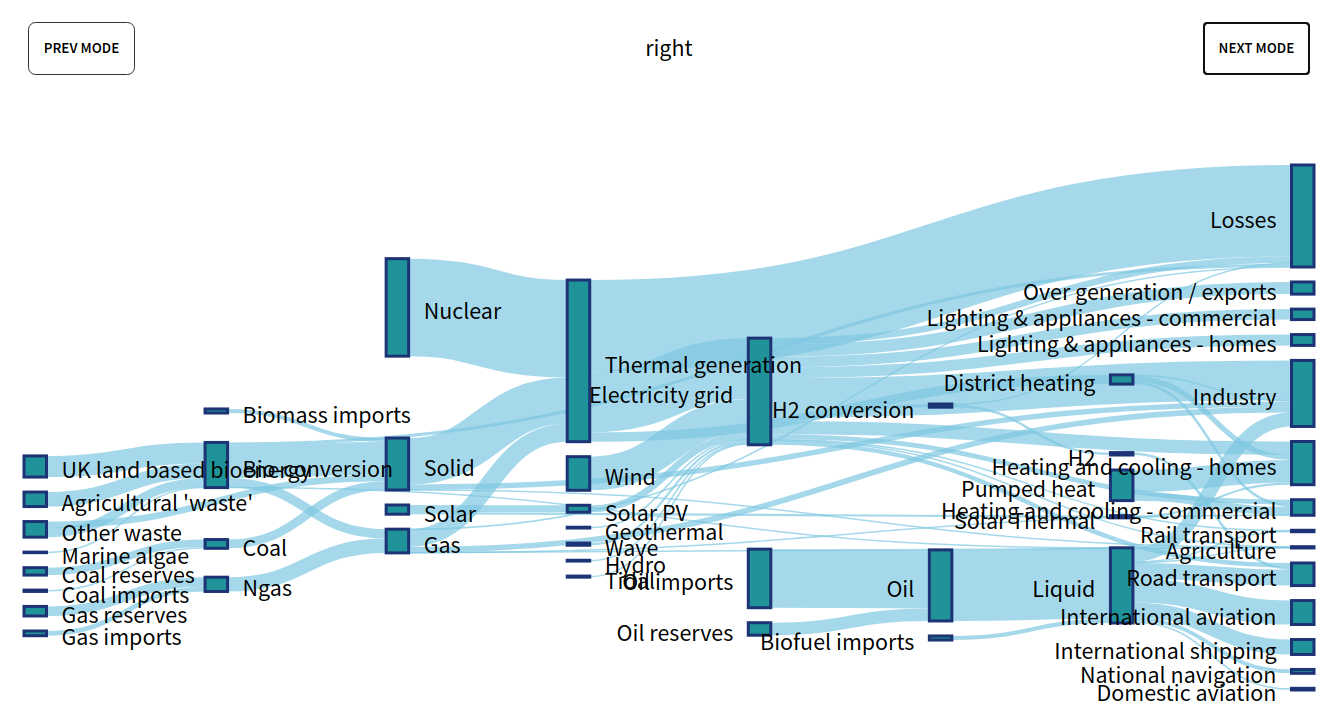
Sankey diagram
Sankey diagram, basic
Sankey diagram, justify
Sankey diagram, left
Sankey diagram, center
Sankey diagram, right
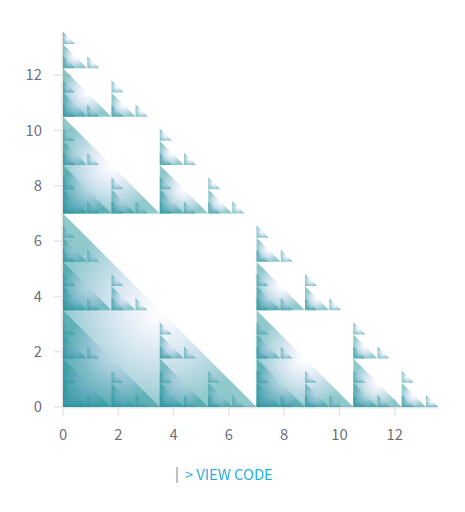
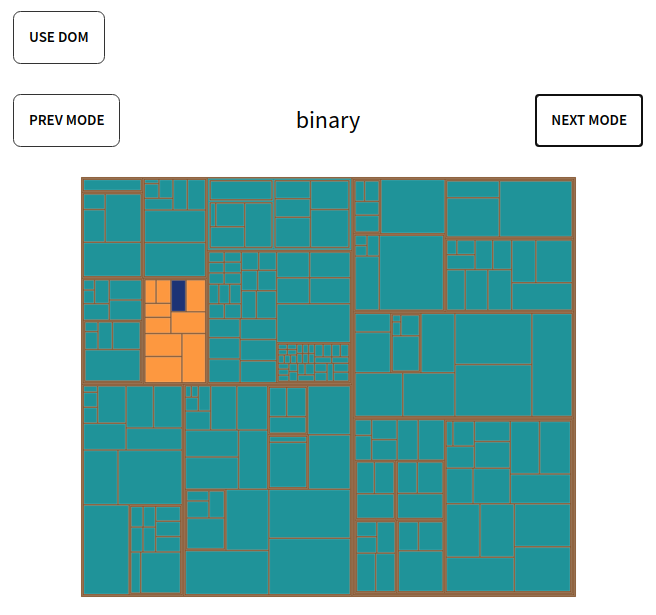
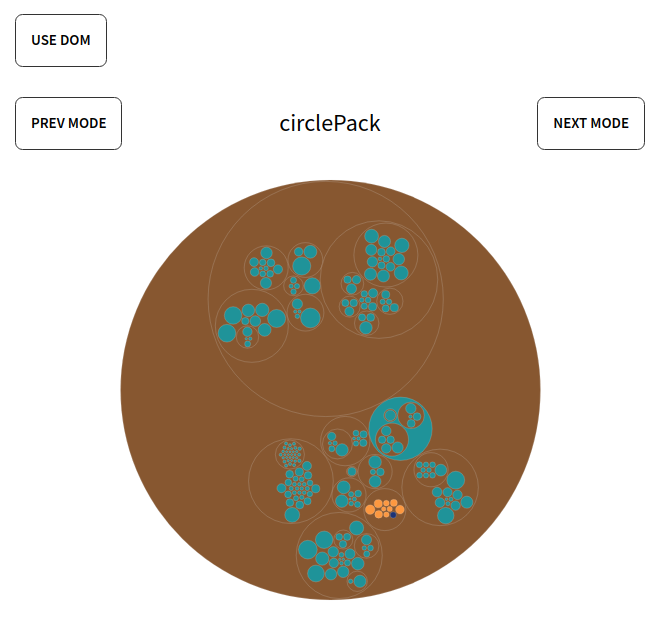
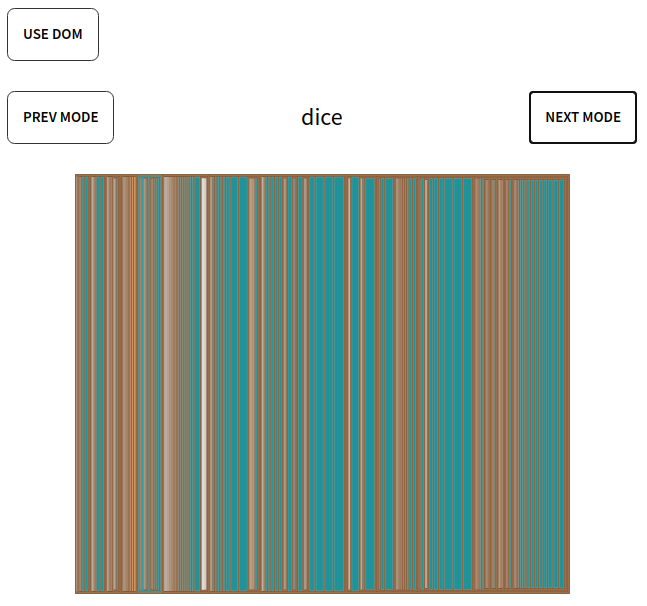
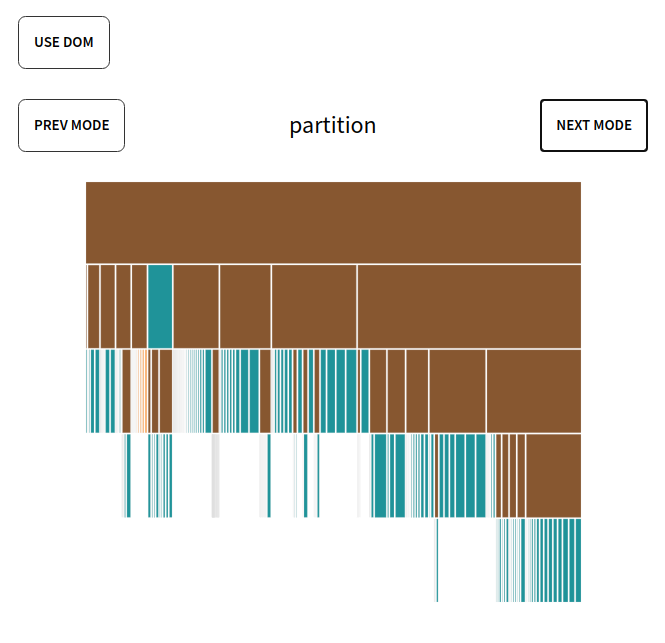
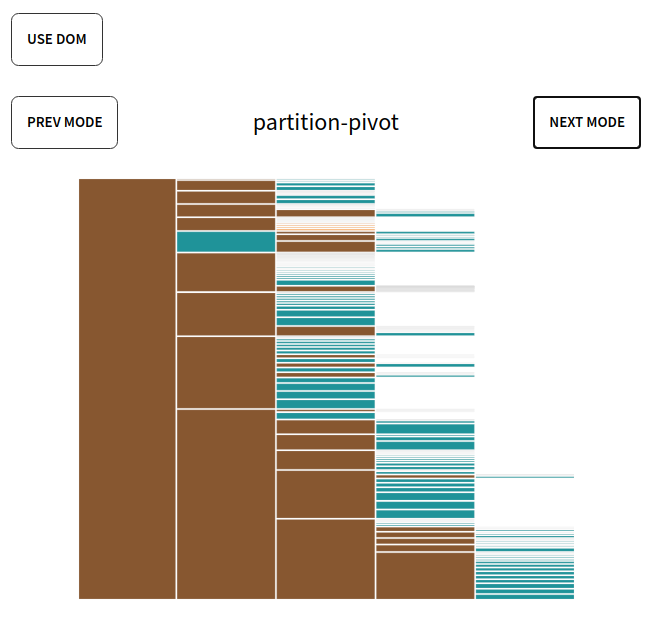
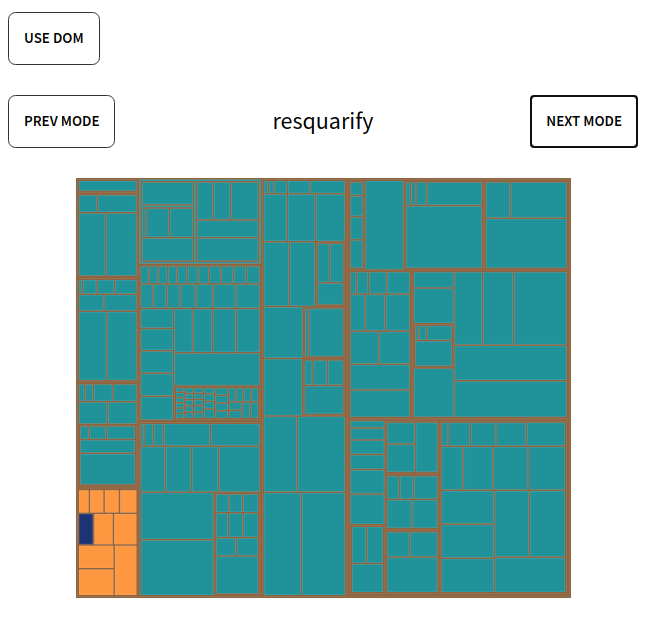
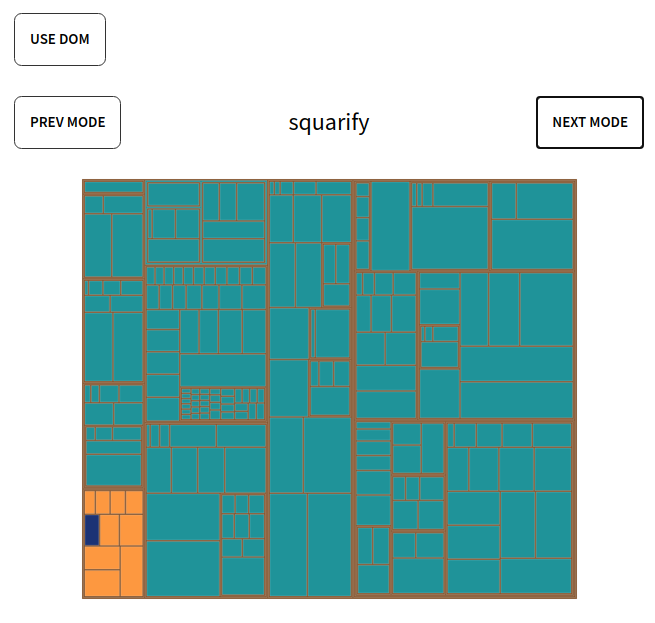
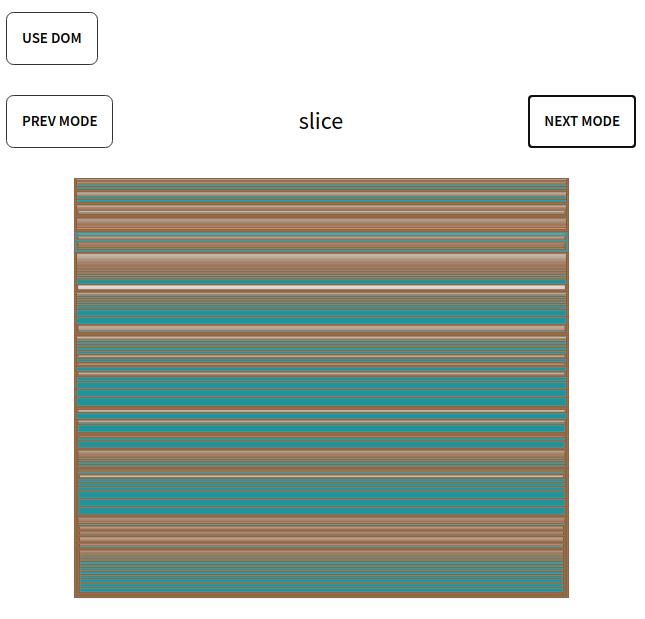
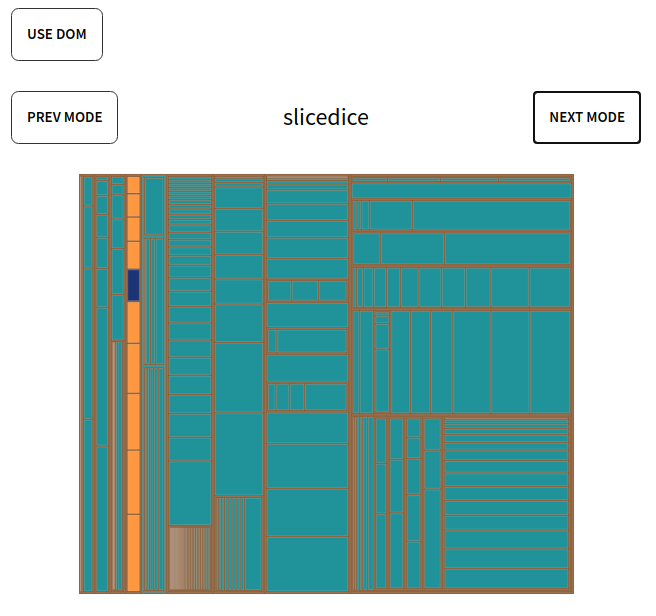
Treemap
binary
circlePack
dice
partition
partition-pivot
resquarify
squarify
slice
slicedice
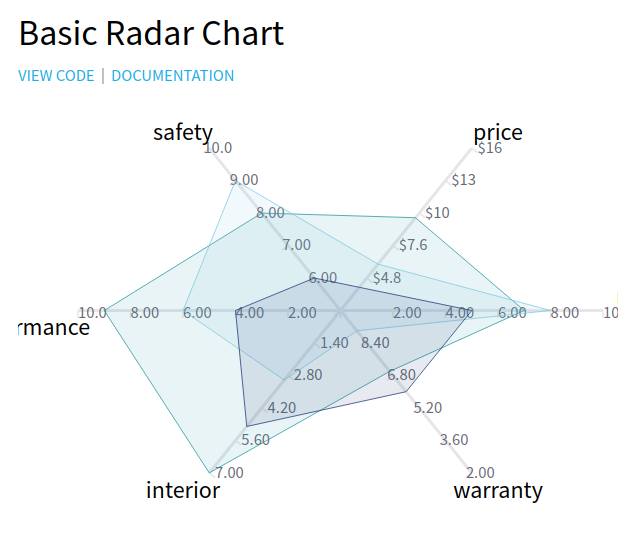
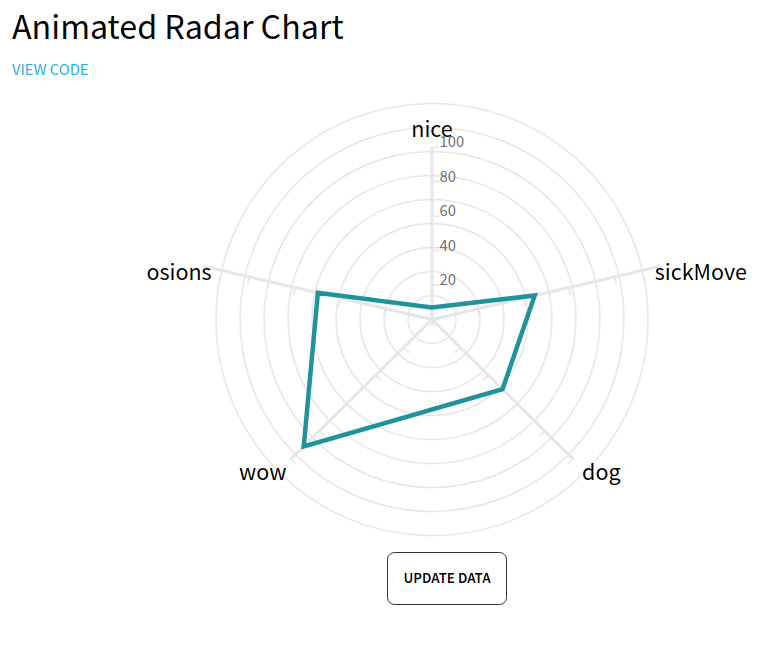
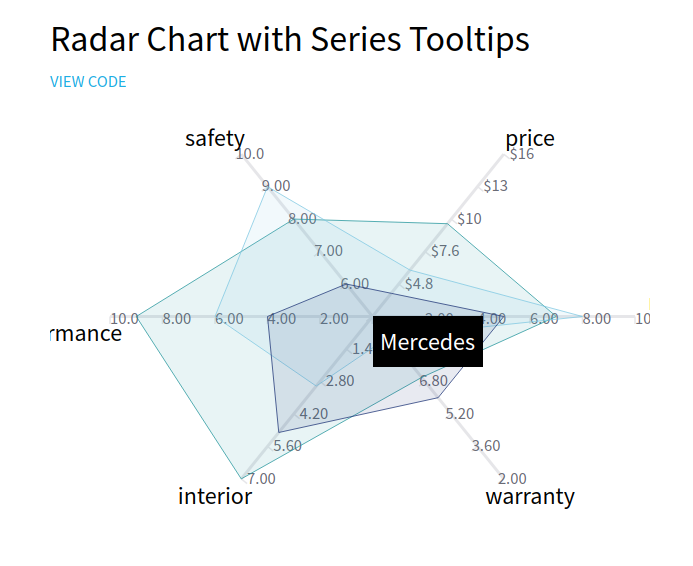
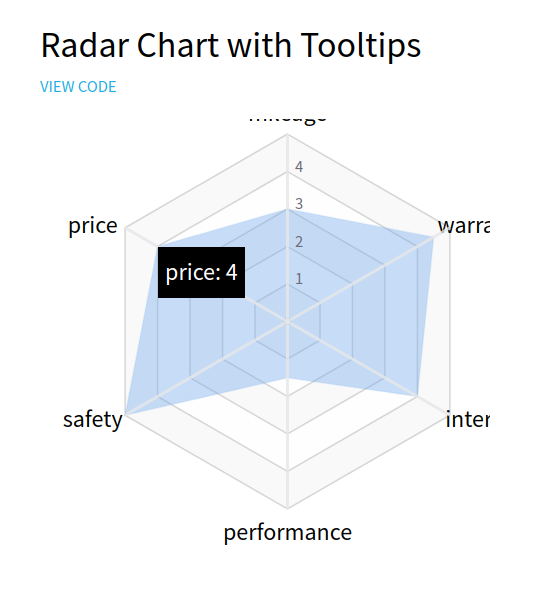
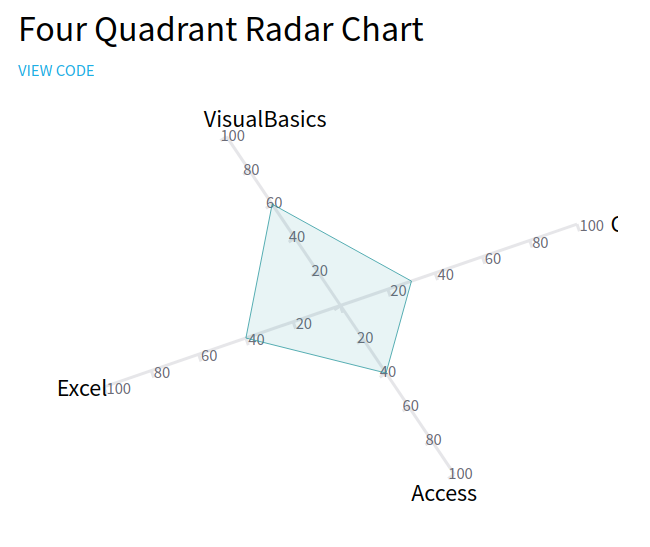
RadarChart
Basic radar chart
Animated radar chart
Tooltips for entire series on radar chart
Tooltips on radar chart
Four quadrants radar chart
Polygon
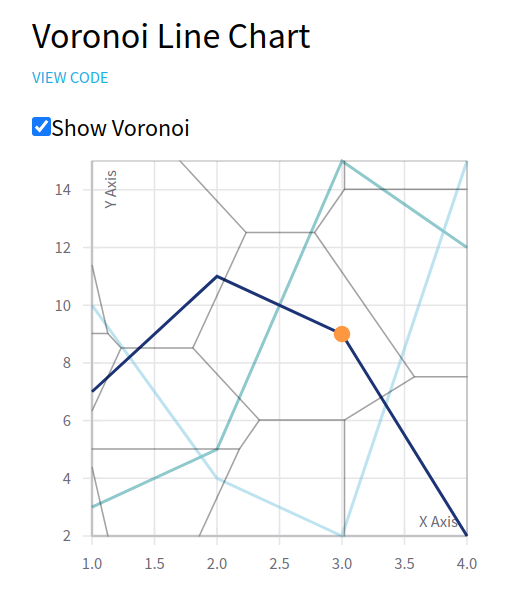
Voronoi diagrams / regions
Visible Voronoi regions on a line chart
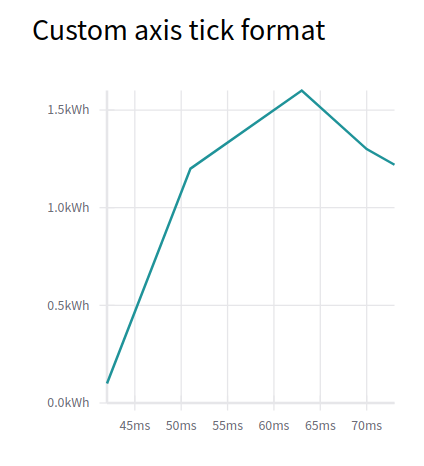
Axes
Custom tick format
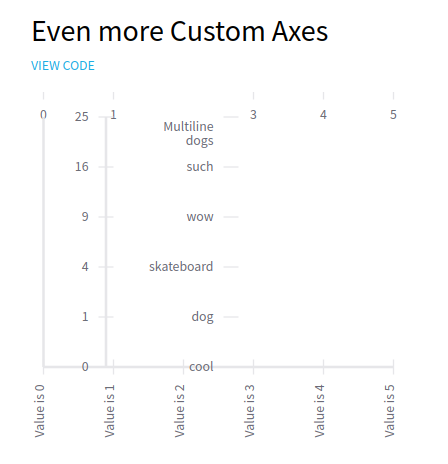
More custom axes
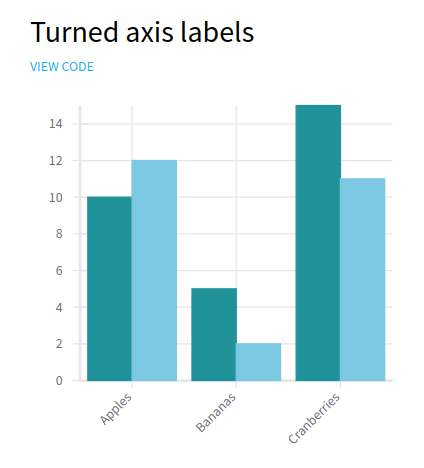
“Turned” axis labels at a 45 degree rotation angle
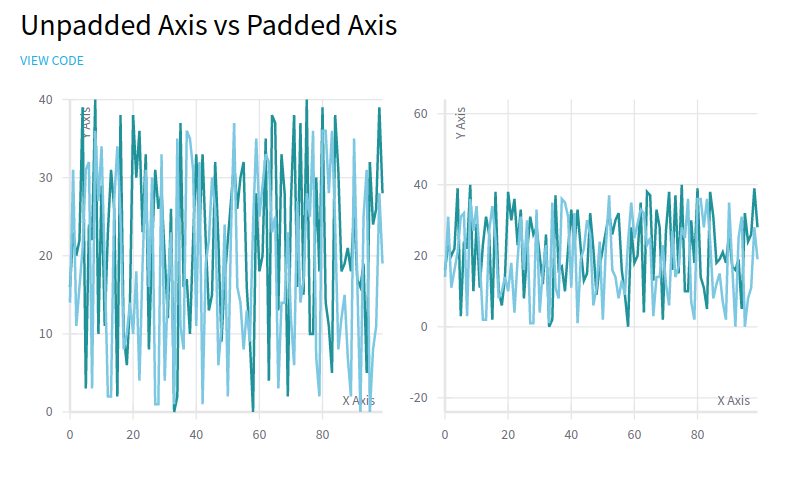
Unpadded vs. padded axis
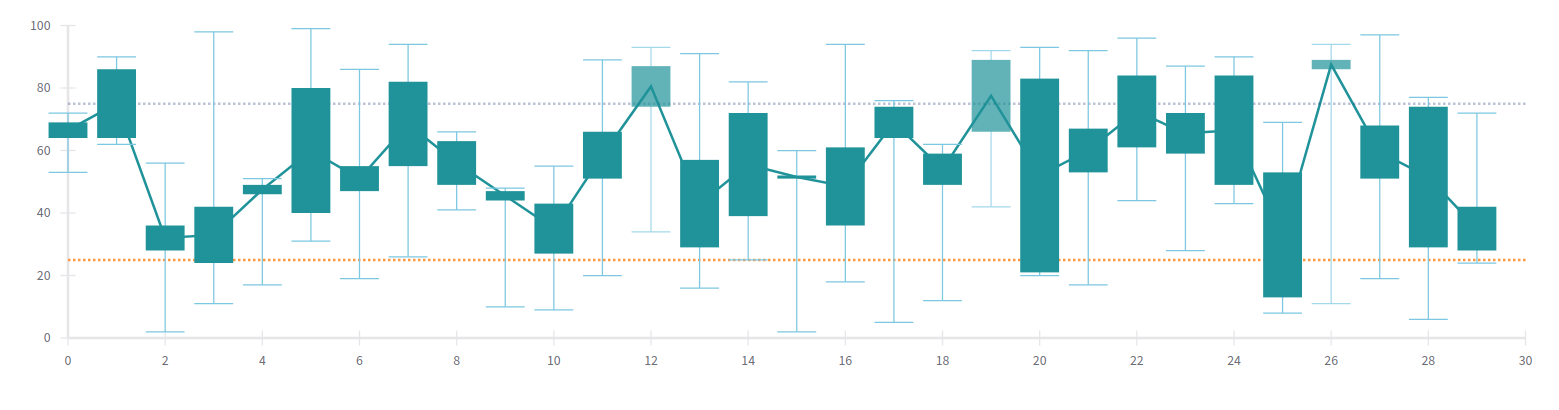
Candlestick
Demonstrates how to extend react-vis with custom visualization components
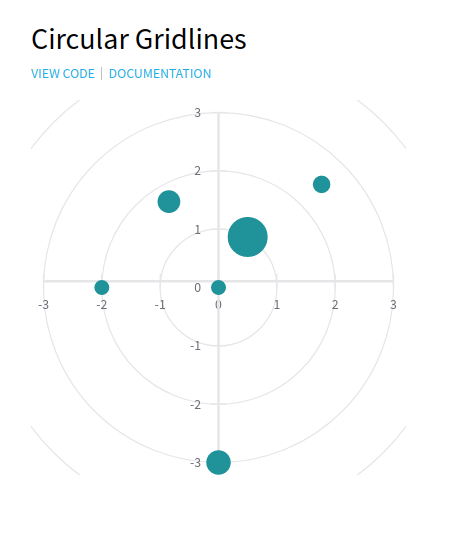
Circular (radial) gridlines
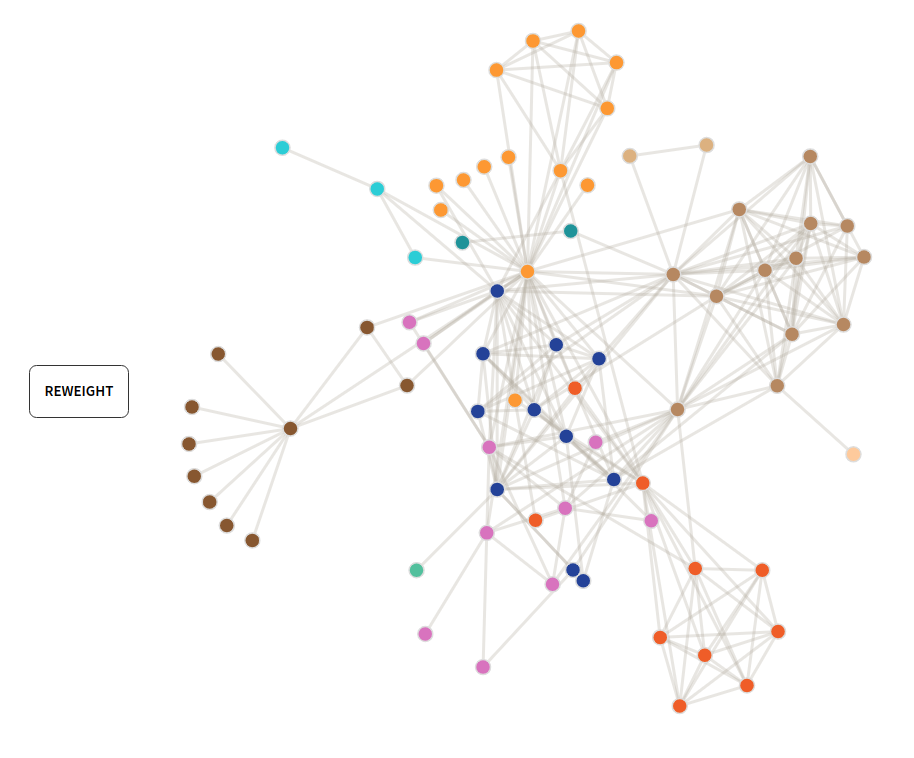
Force-directed graph
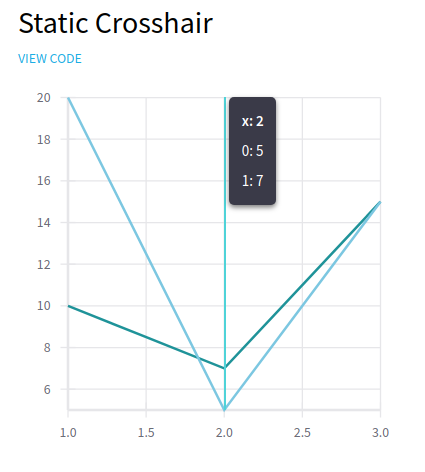
Crosshair
Static Crosshair
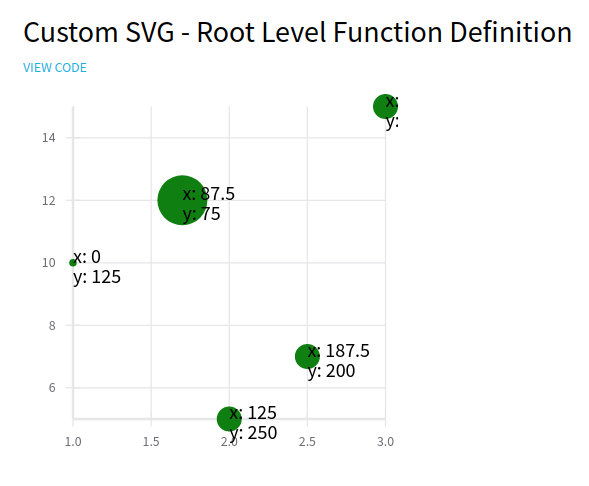
Custom SVG
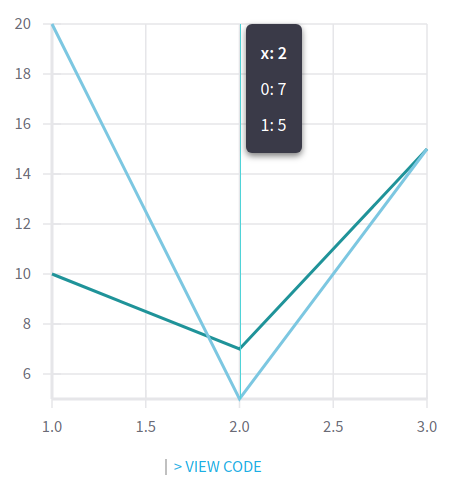
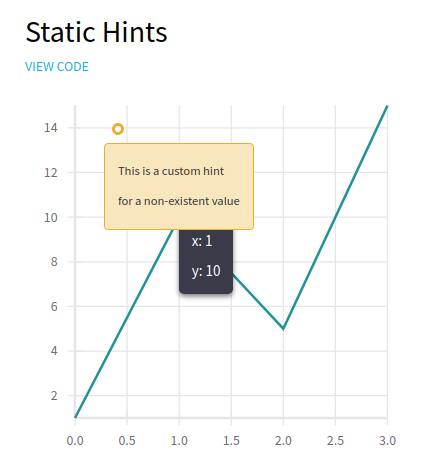
Tooltips / Hint
Static hints are always visible
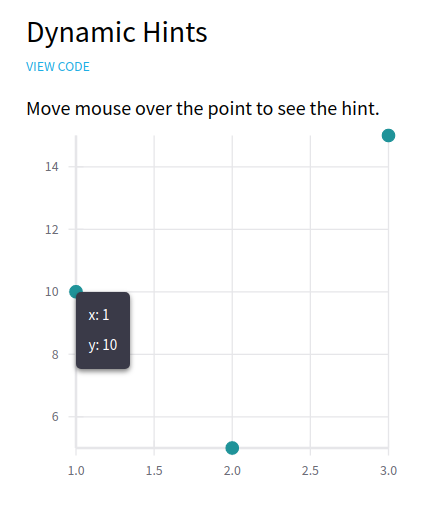
Dynamic hints appear on mouseover
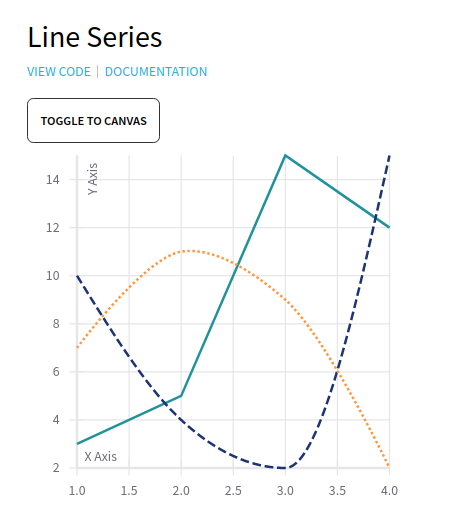
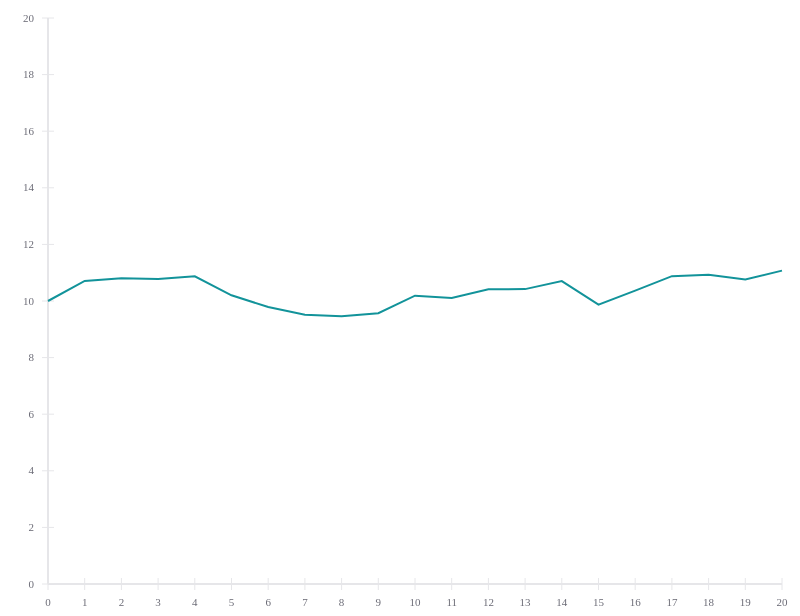
Line series
Basic line series
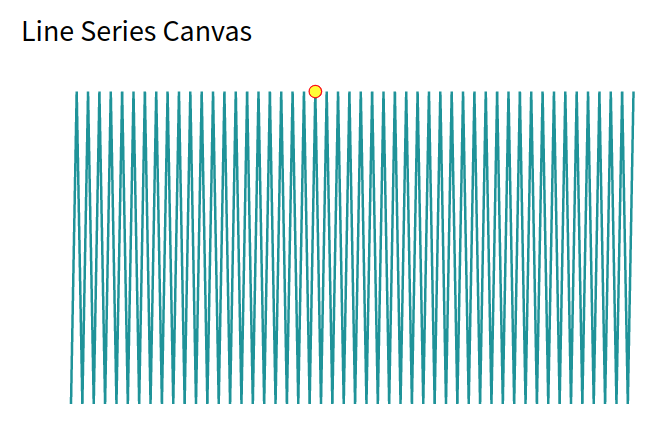
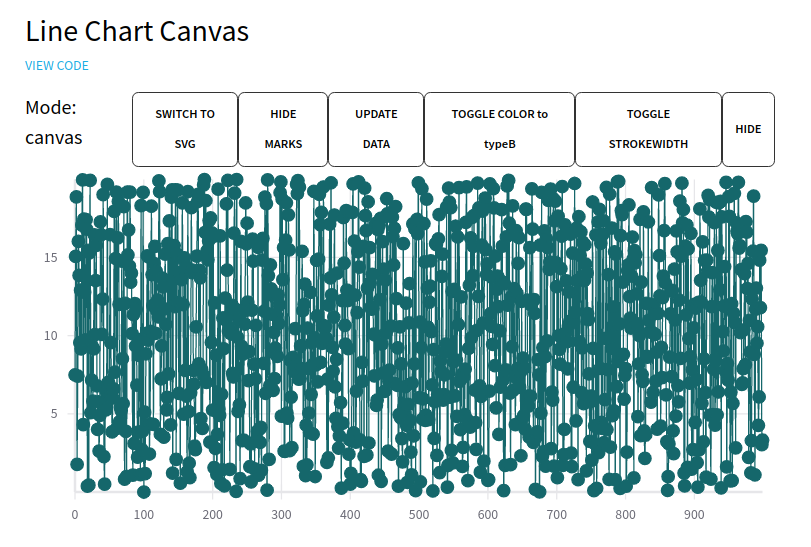
Line series Canvas
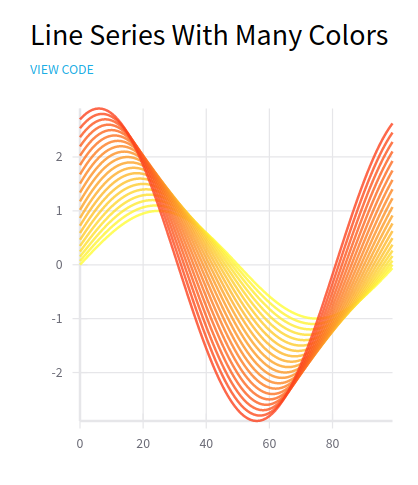
Line series with many colors
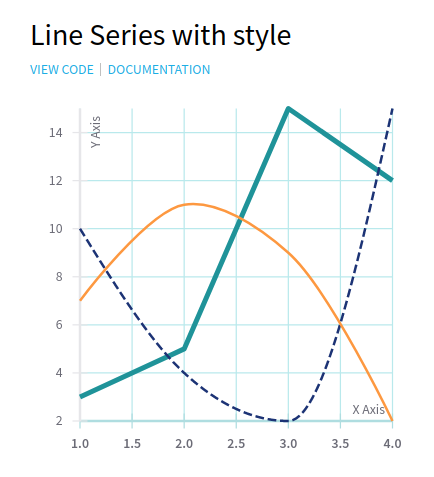
Line series with style
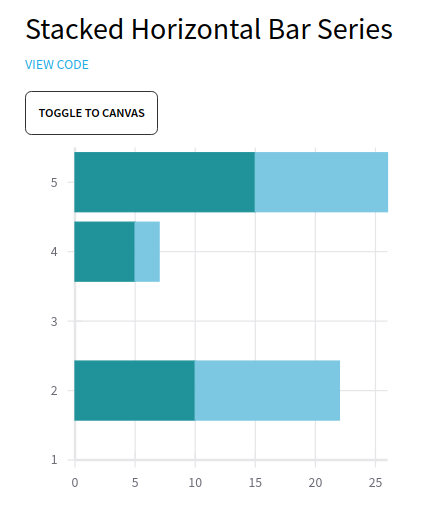
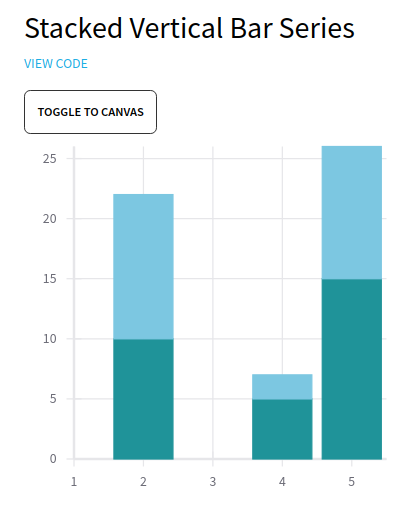
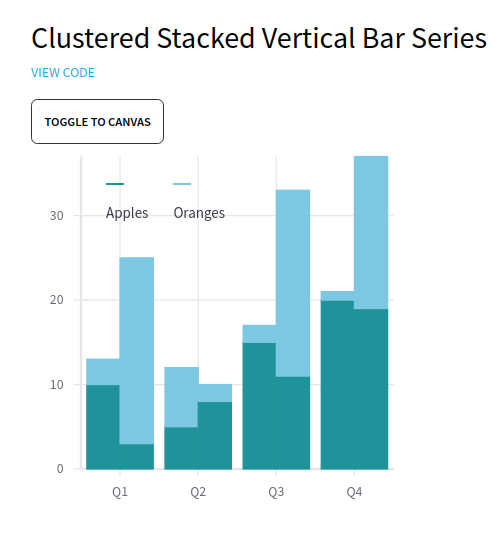
Horizontal & Vertical bar series
Stacked horizontal bar series
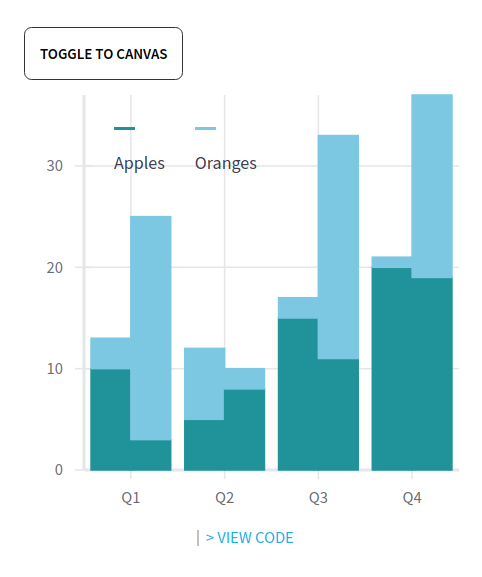
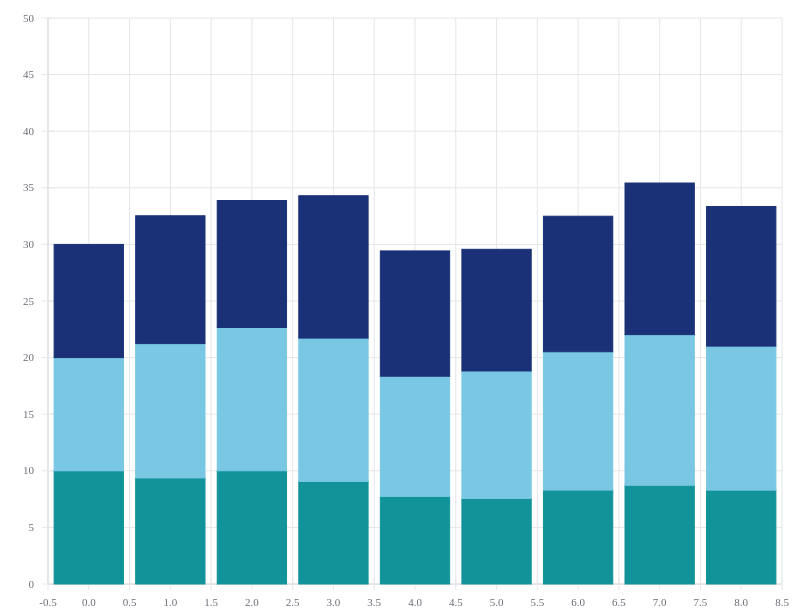
Stacked vertical bar series
Clustered stacked vertical bar series
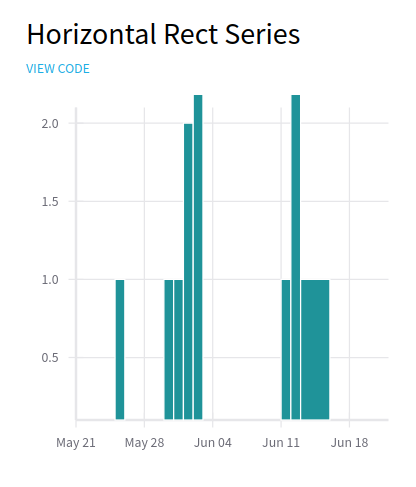
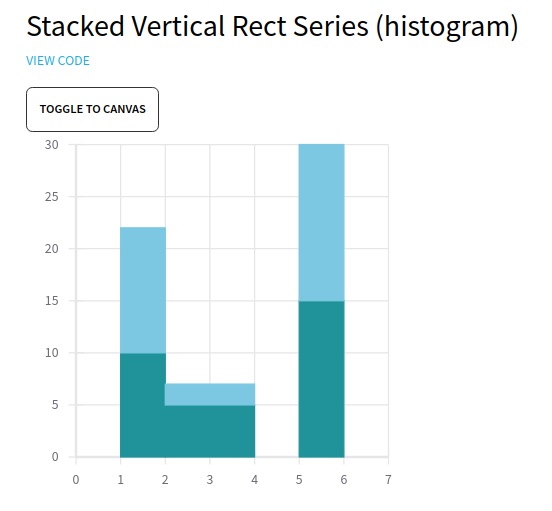
Horizontal & Vertical RectSeries
RectSeries is a generalization of BarSeries that lets you also control the perpendicular dimension of each ‘bar’.
Horizontal rect series
Stacked vertical rect series (histogram)
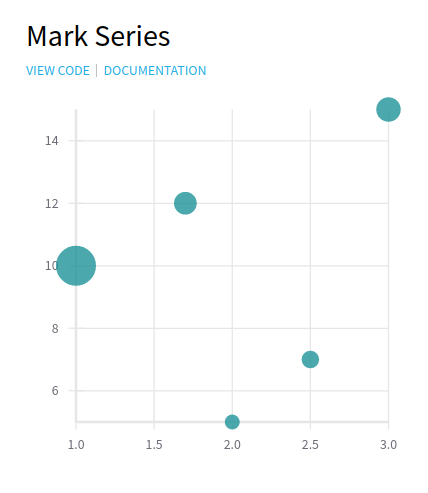
Mark series
Mark series
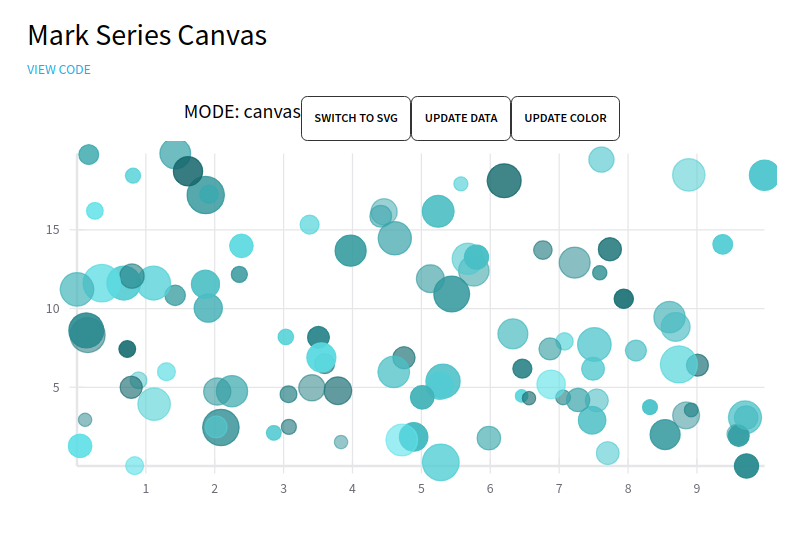
Mark series Canvas
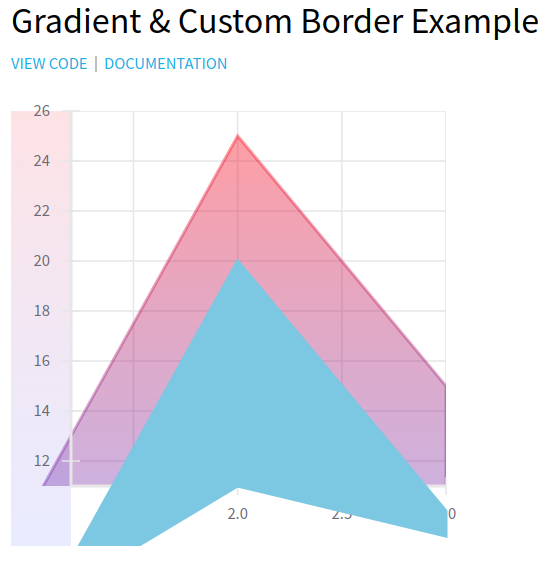
Borders
Gradient series fill & custom gradient border fill
Misc.
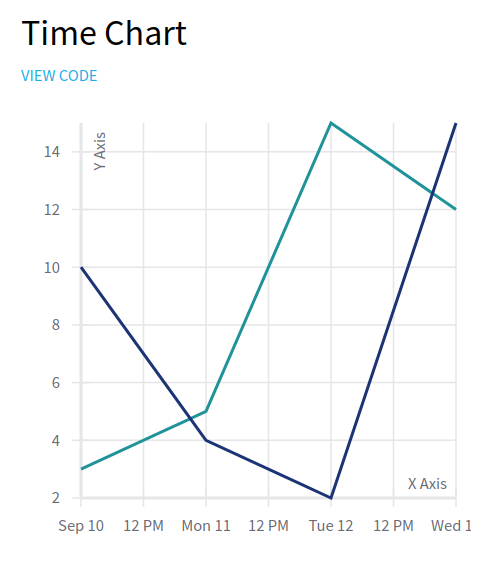
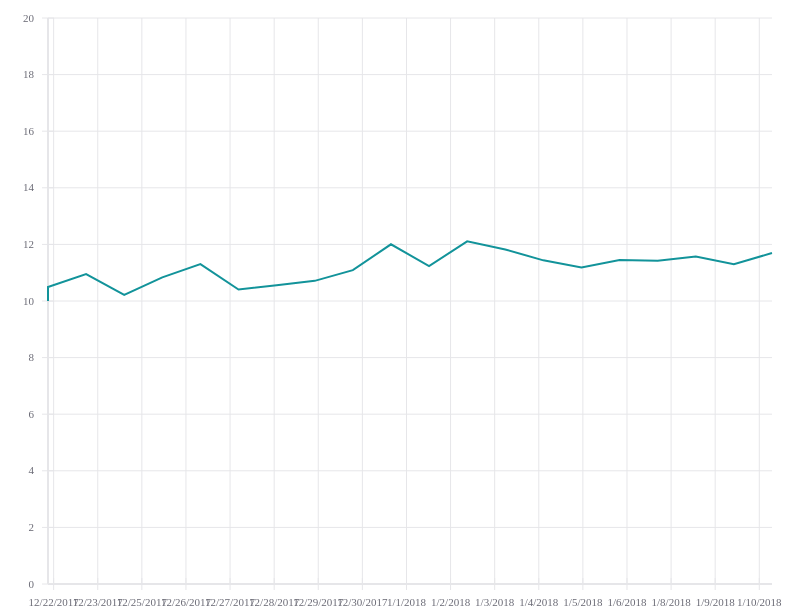
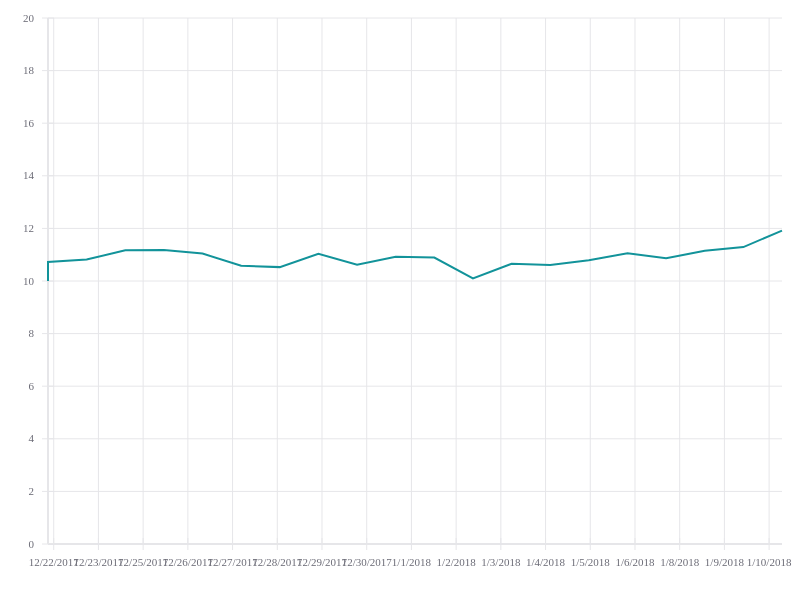
Time chart
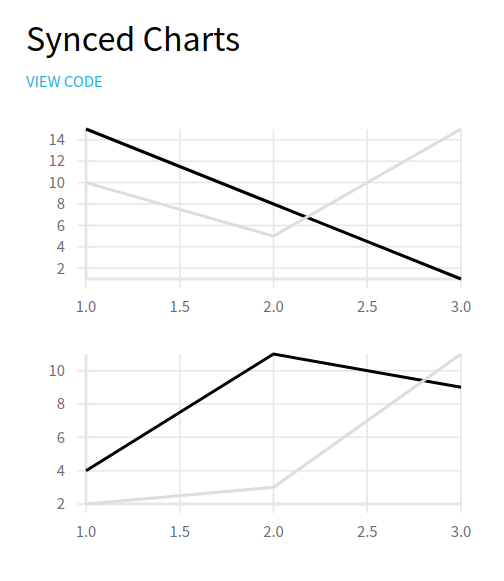
Synced charts
Label series
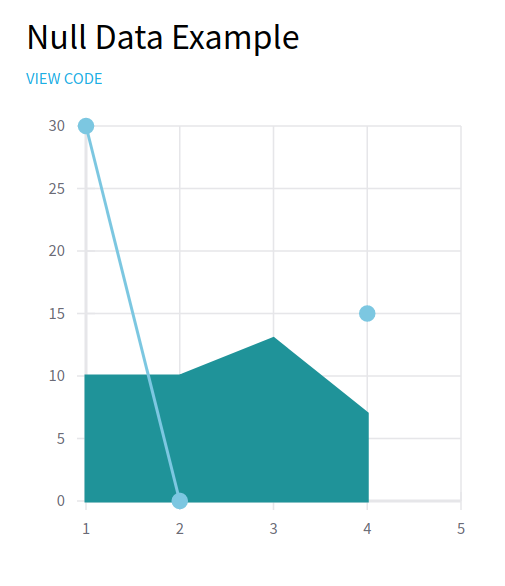
Null data
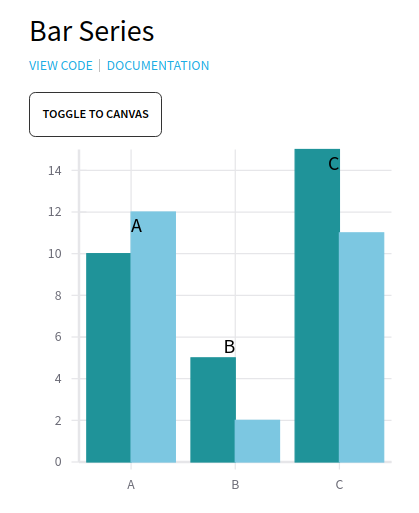
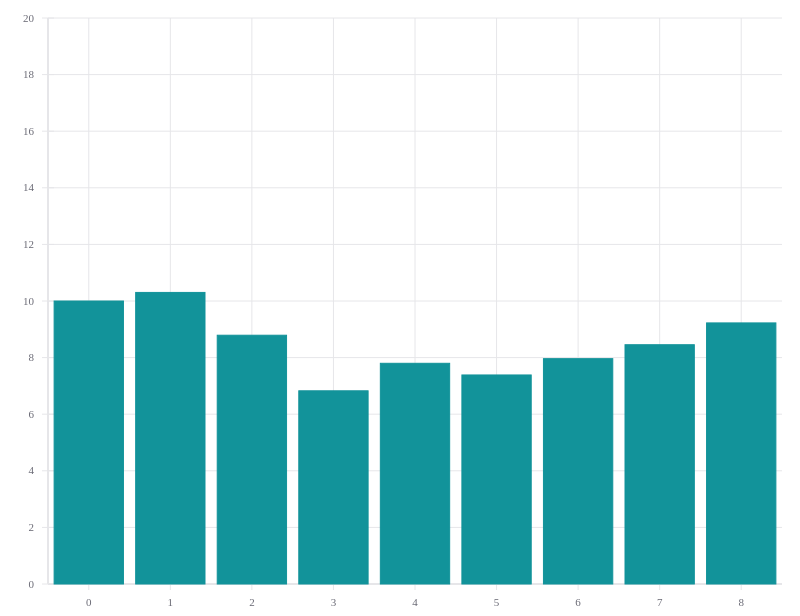
Bar series
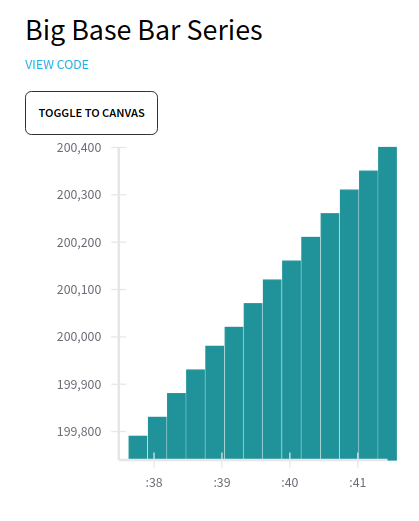
Big base bar series
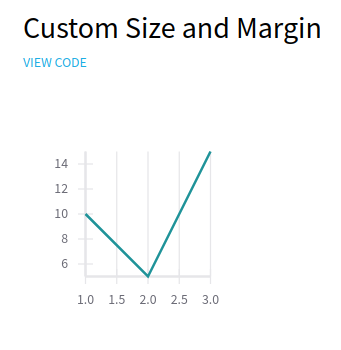
Custom size and margin
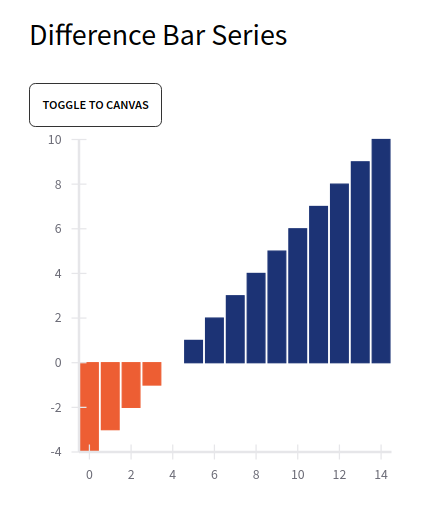
Difference bar series
Line chart Canvas
LineMark series
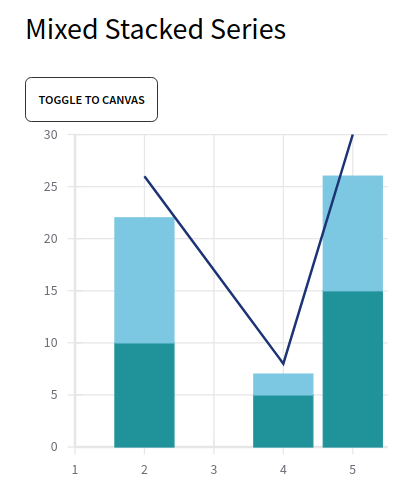
Mixed stack series
Scales
Category scale
Ordinal scale
Time scale
Axis formatting
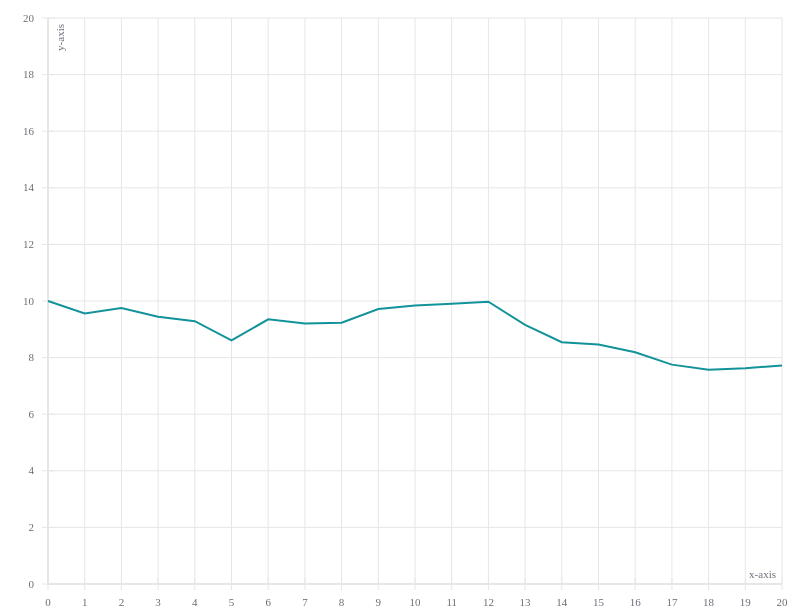
Axis orientation - XAxis on bottom & YAxis on left
Labelled axes w/ horizontal & vertical gridlines
Fewer ‘ticks’ along X & Y axes
Tick ‘size’ (length of ‘tick mark’, perpendicular to each axis)
.png)
.png)
Tick orientation: label’s rotation angle
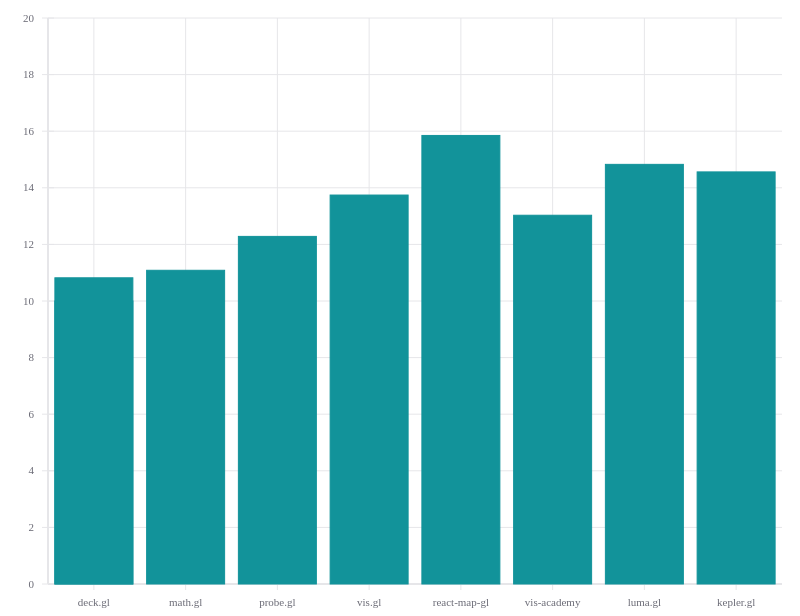
VerticalBarSeries
Stacked VerticalBarSeries
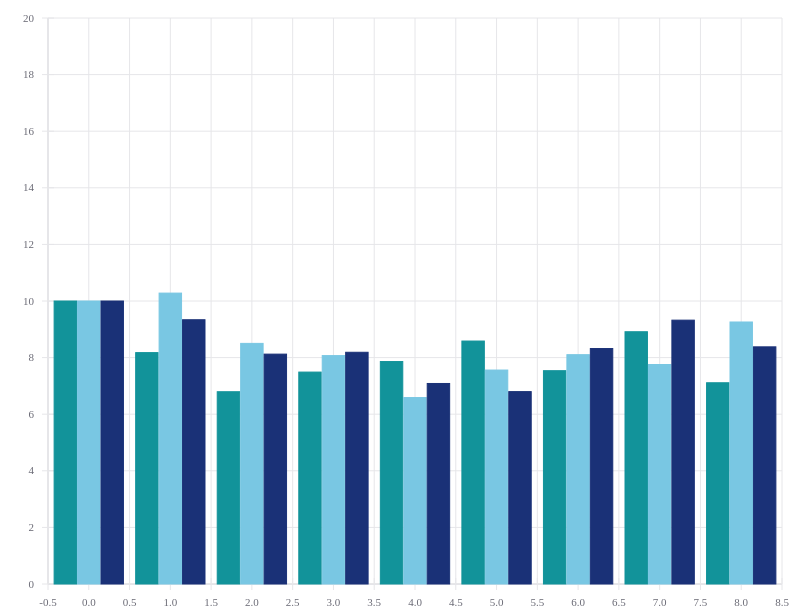
Clustered (side-by-side) VerticalBarSeries
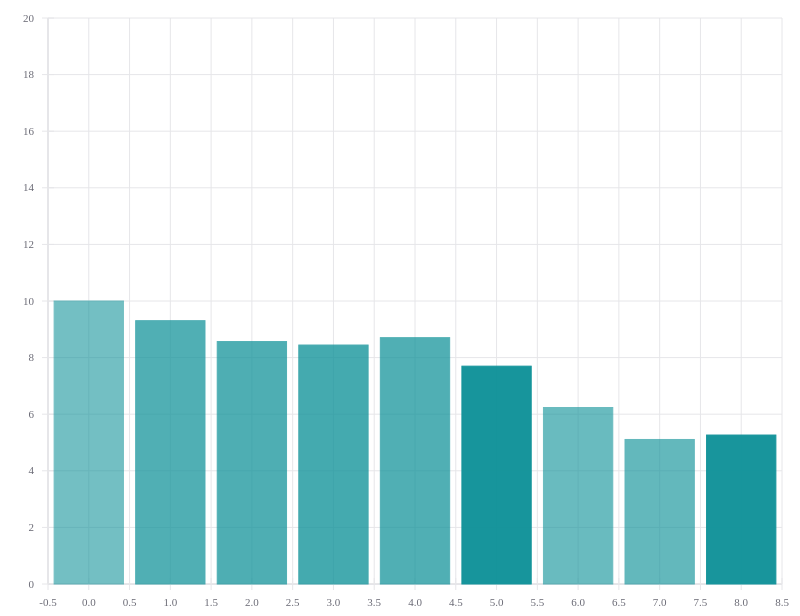
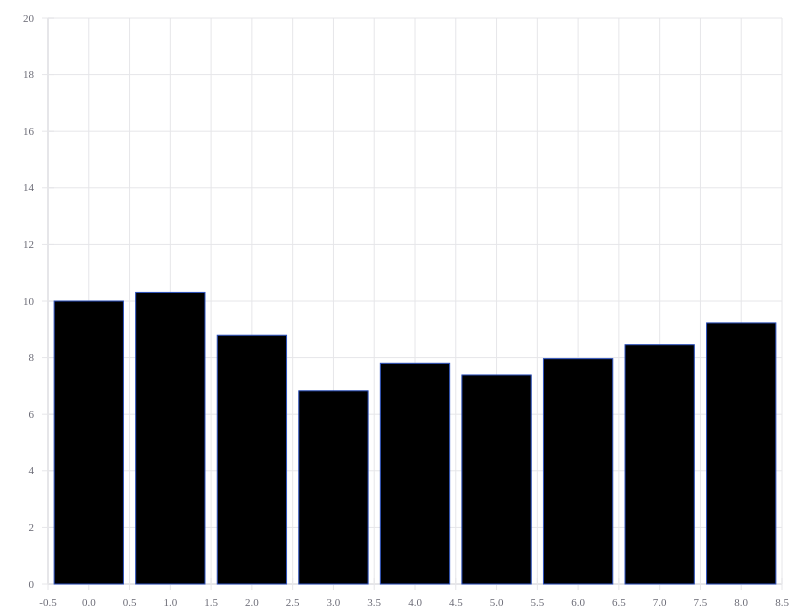
Single VerticalBarSeries

VerticalBarSeries styling - by data point
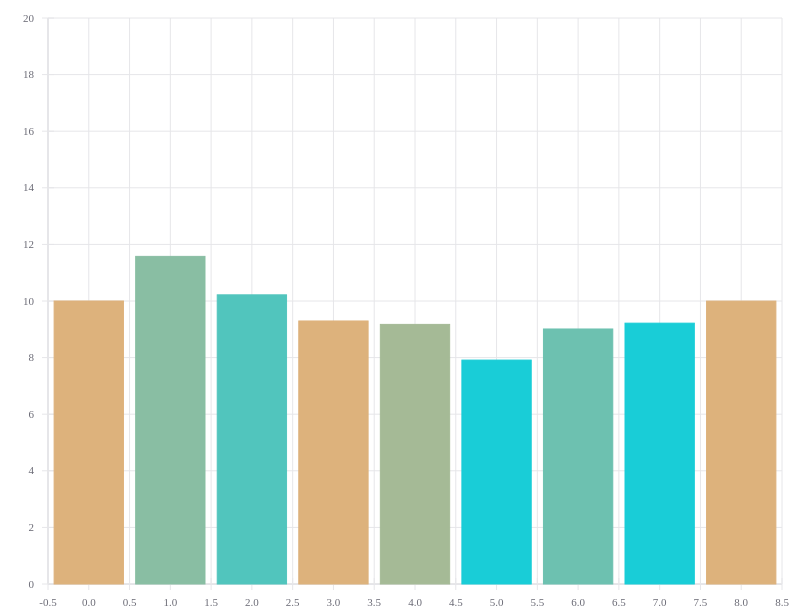
Color
Opacity
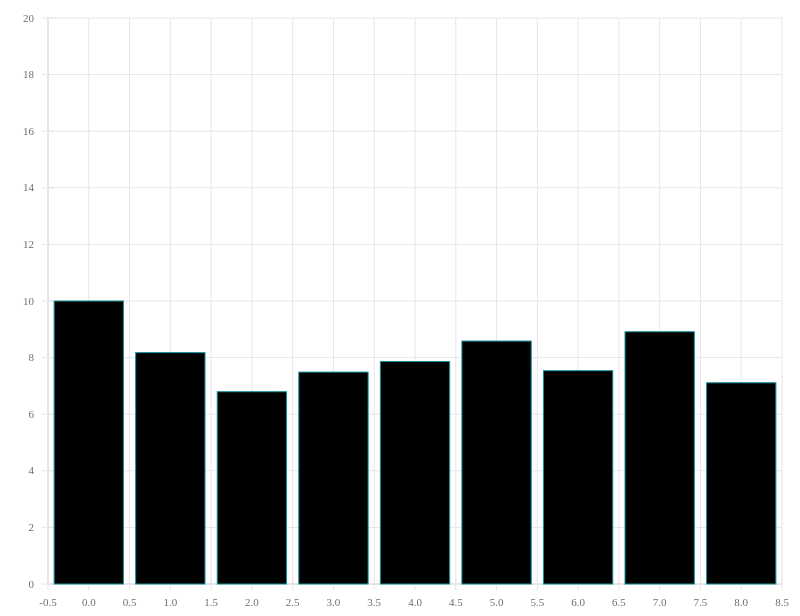
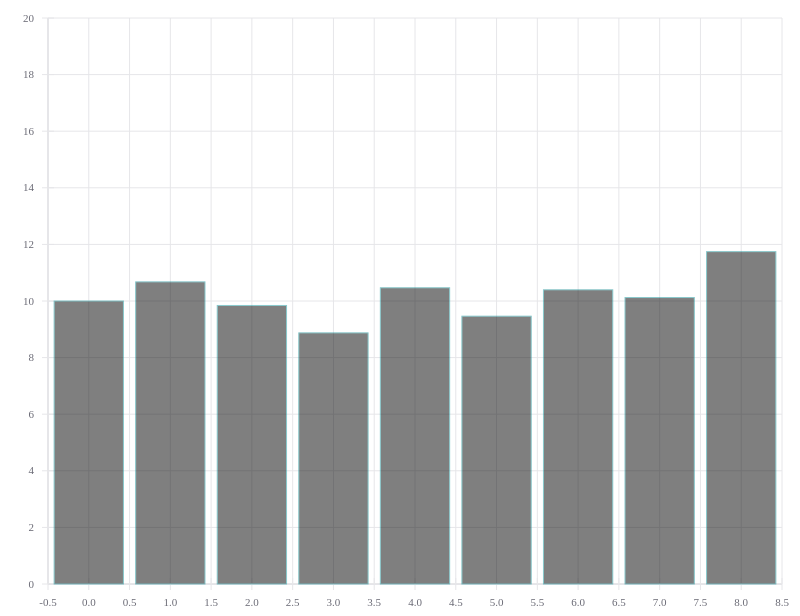
VerticalBarSeries styling - entire series
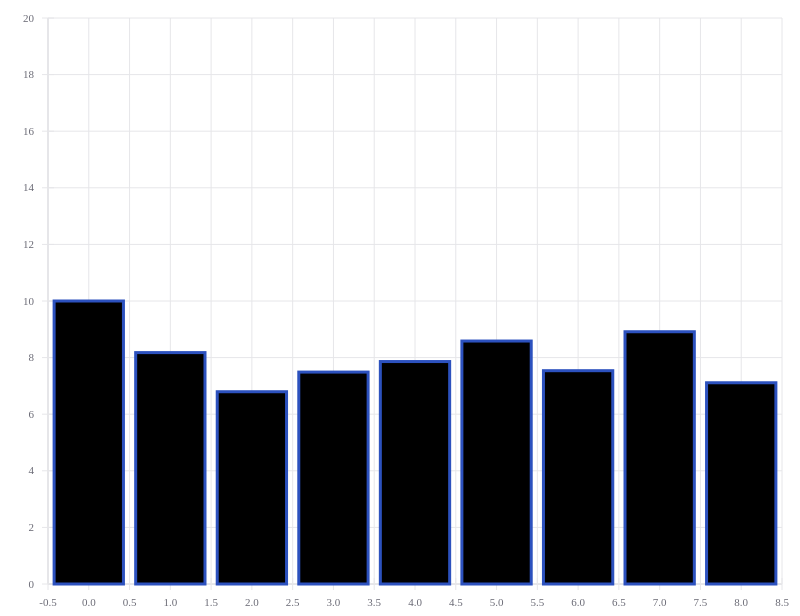
Stroke
Fill
Opacity
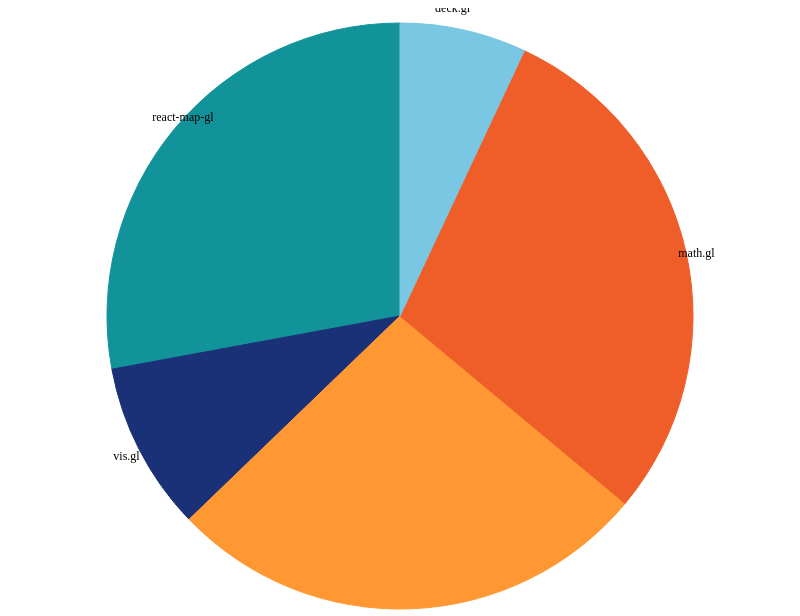
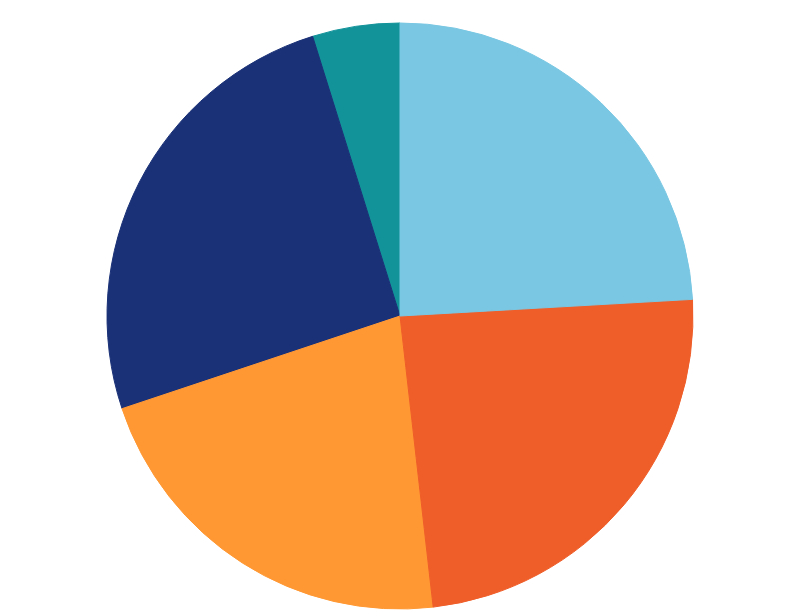
Pie chart
Single pie chart with labels
Single pie chart without labels
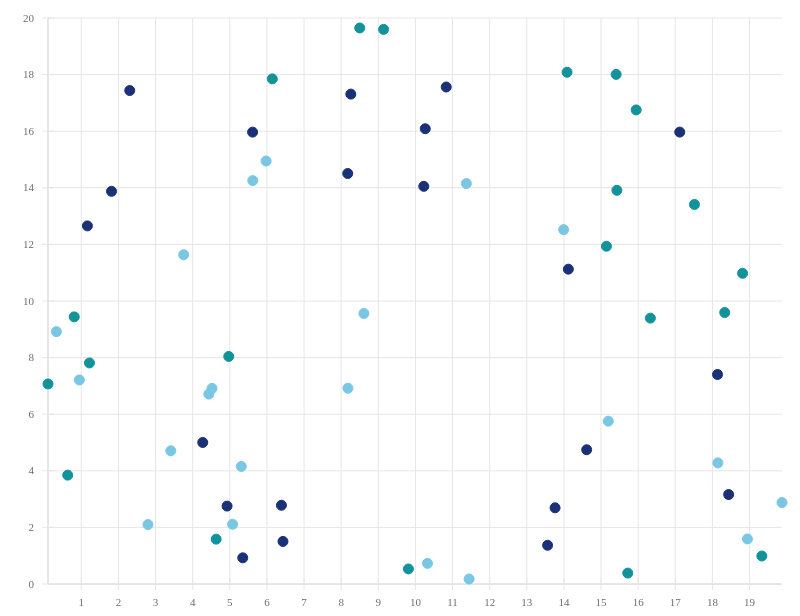
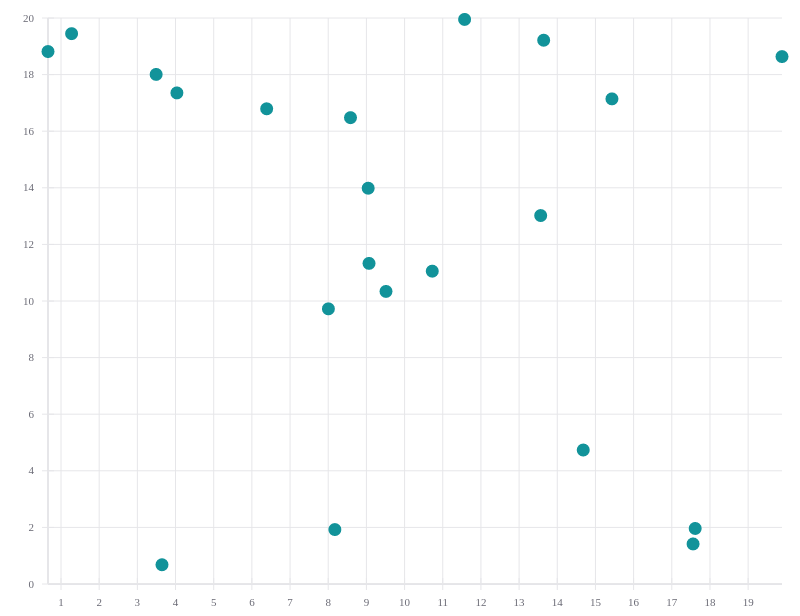
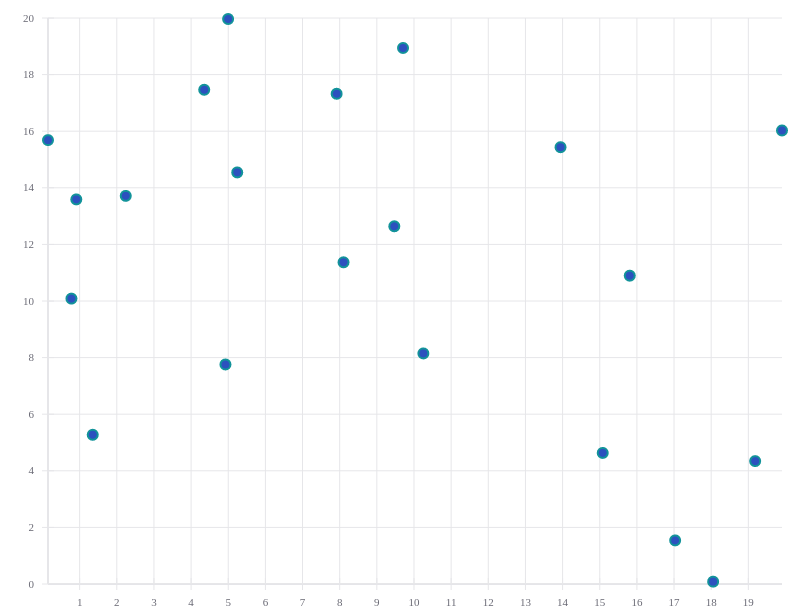
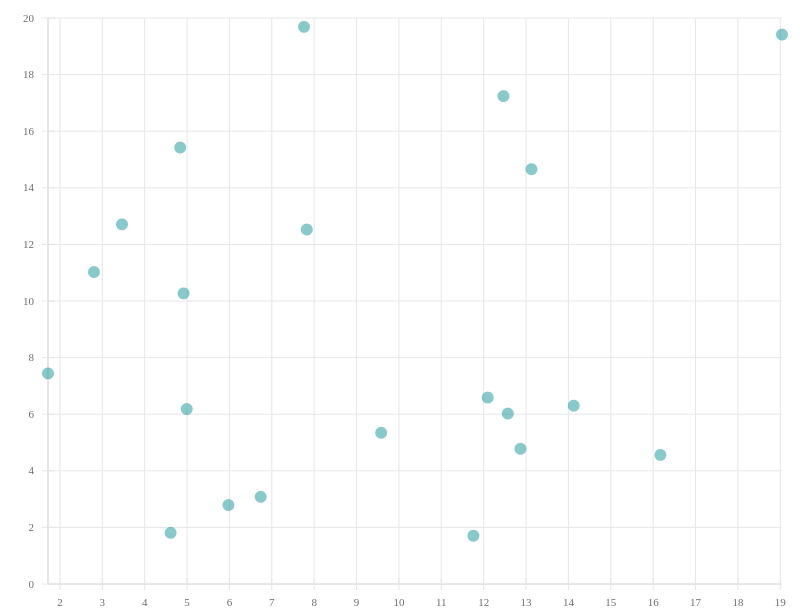
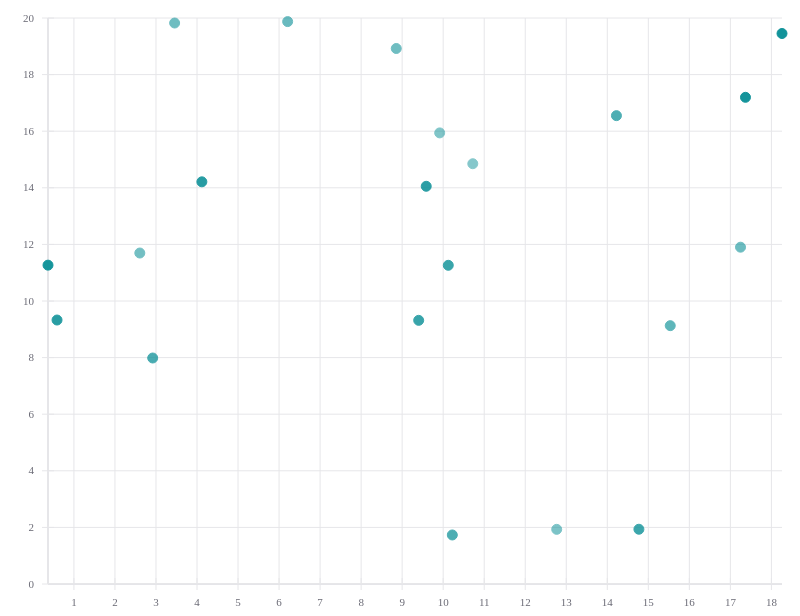
MarkSeries
Multiple MarkSeries
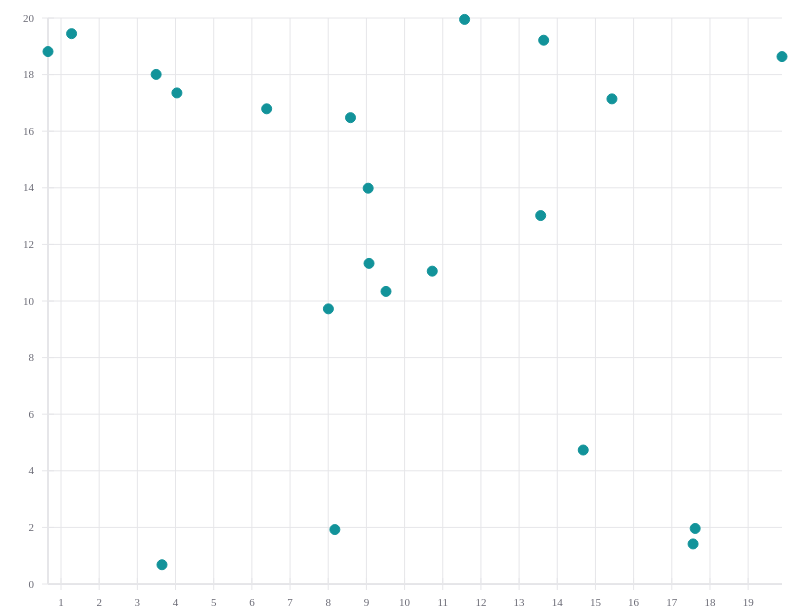
Single scatter plot
MarkSeries styling - entire series
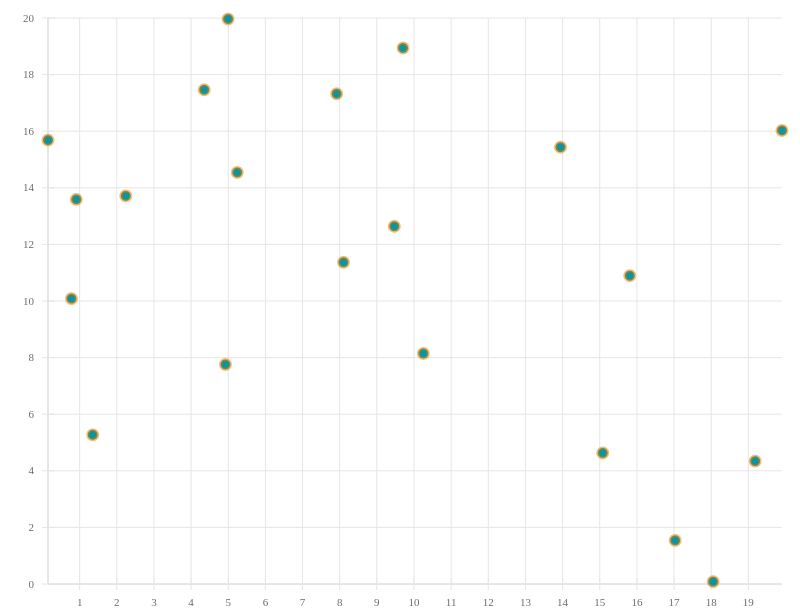
Stroke
Stroke width
Fill
Opacity
MarkSeries styling - by data point
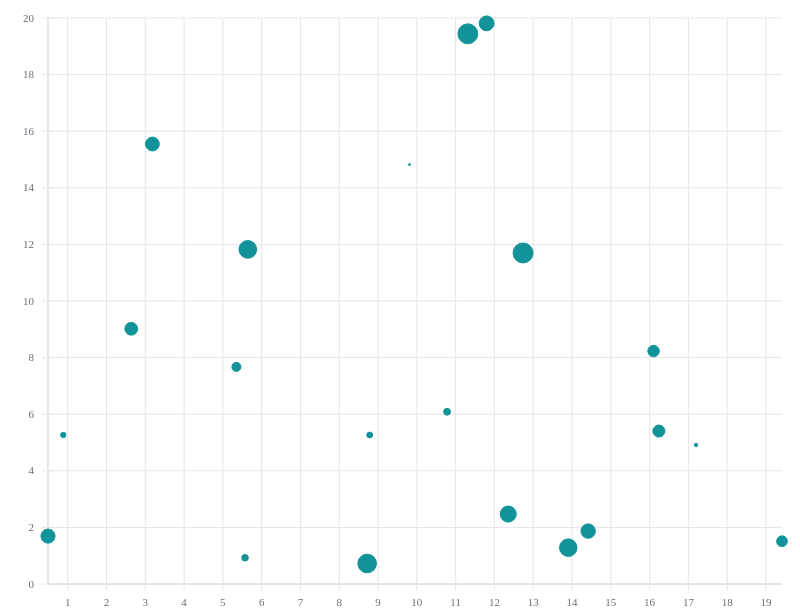
Size
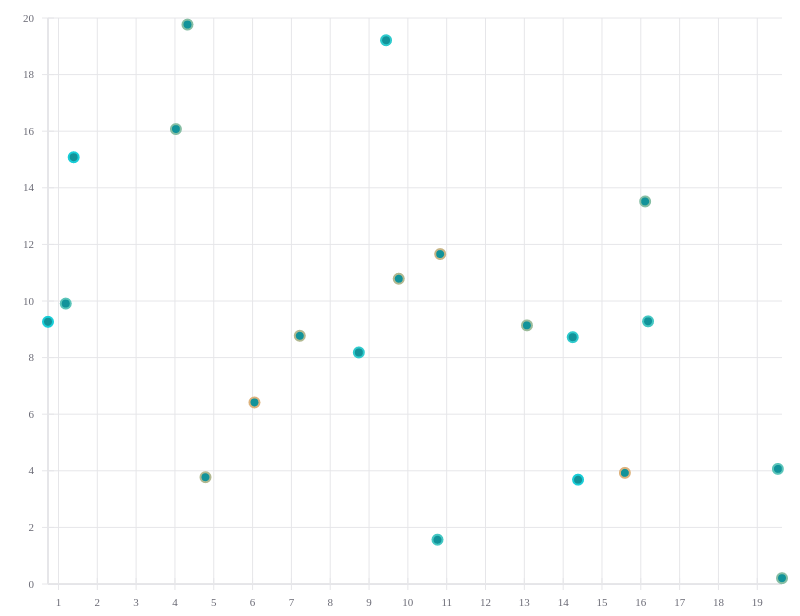
Stroke
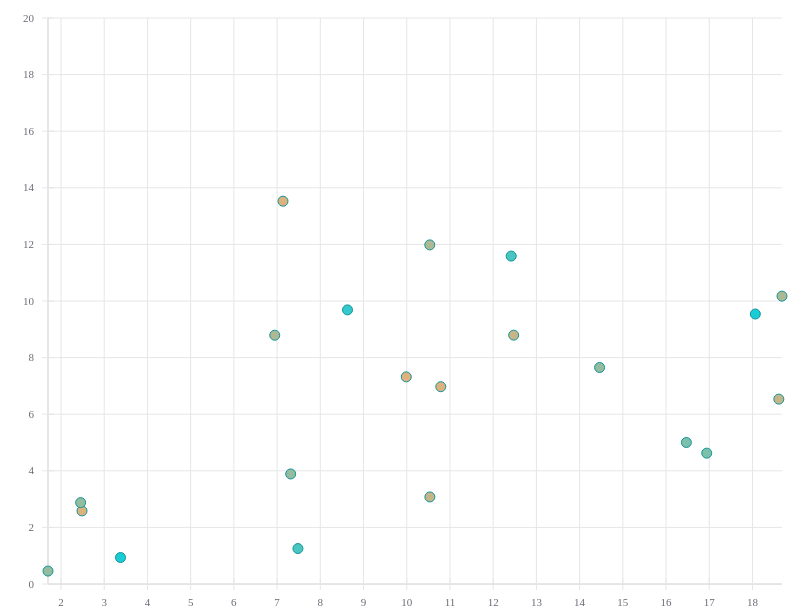
Fill
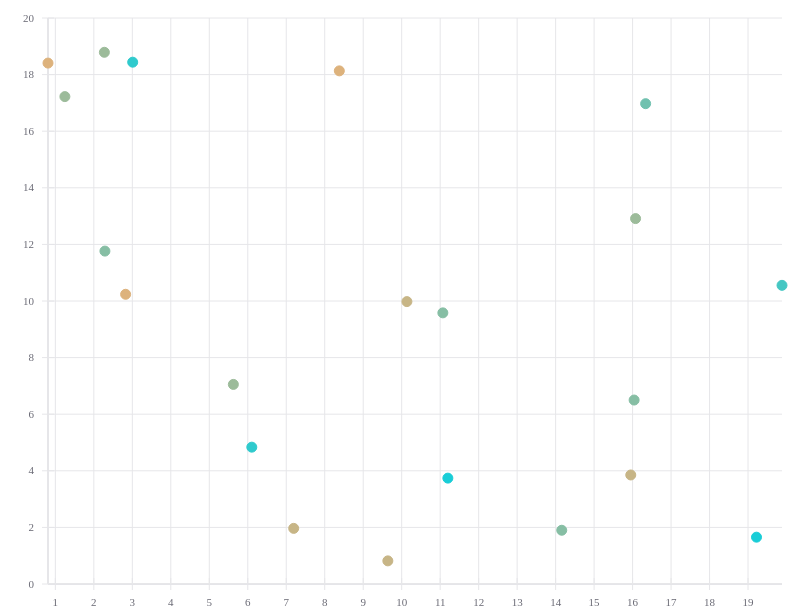
Color
Opacity
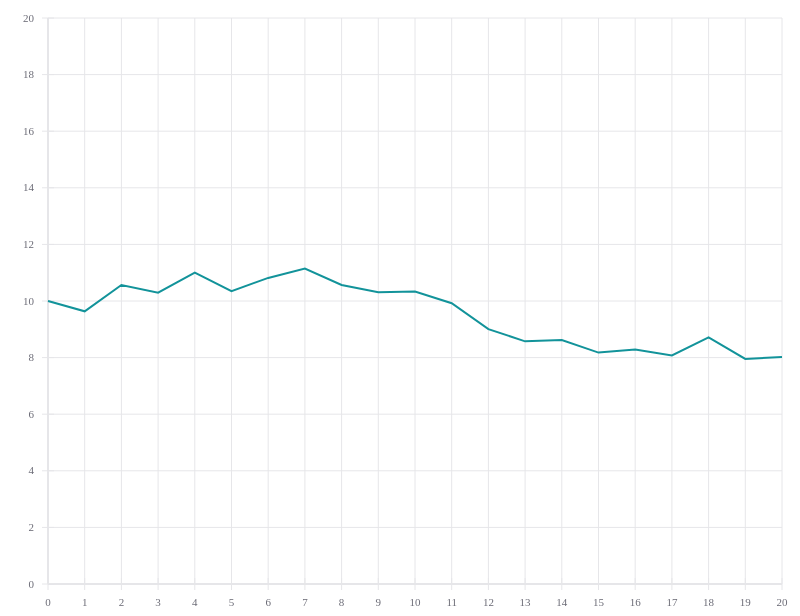
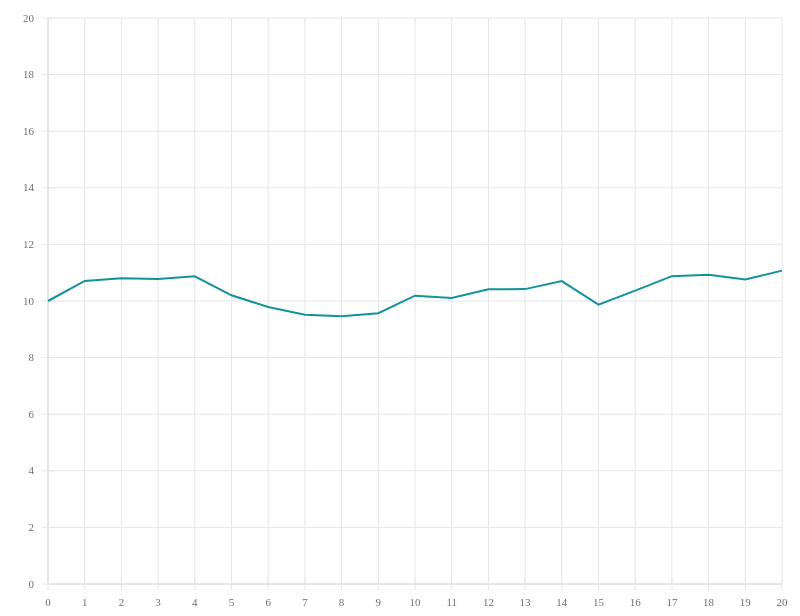
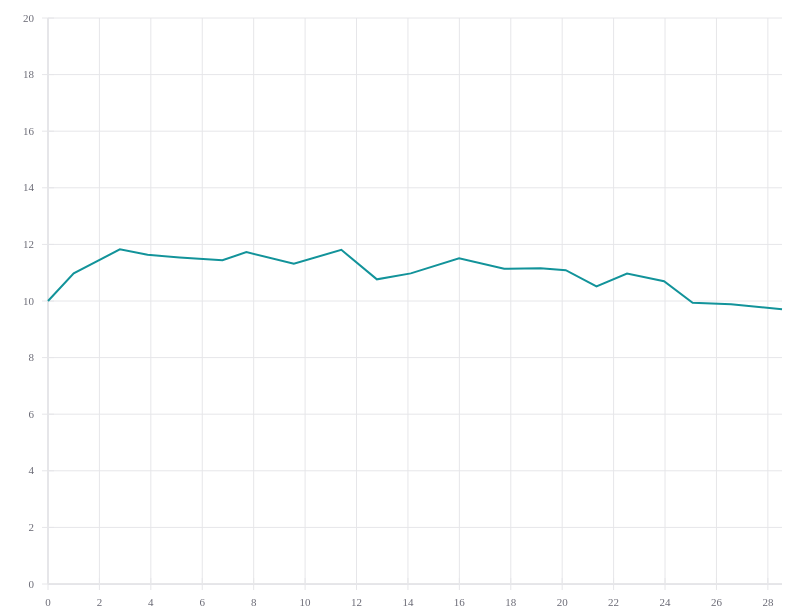
LineSeries
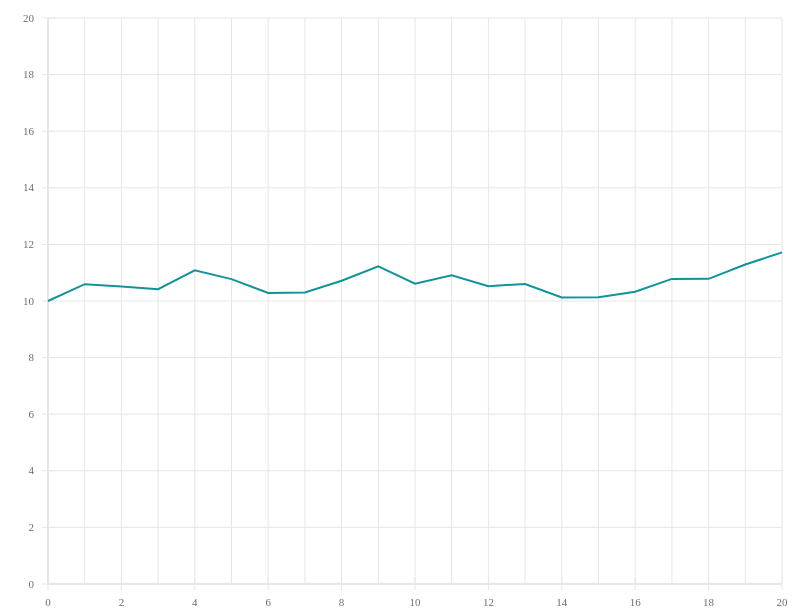
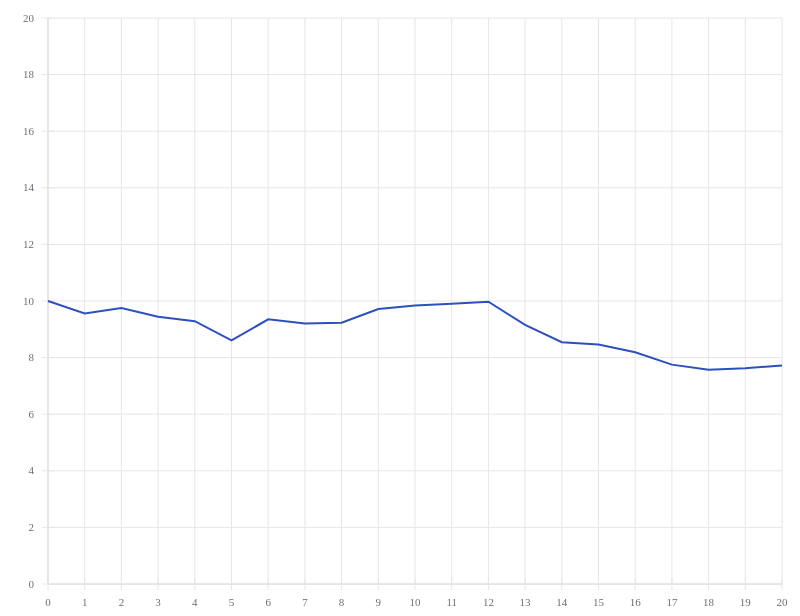
Single line chart
Non-uniform numbers
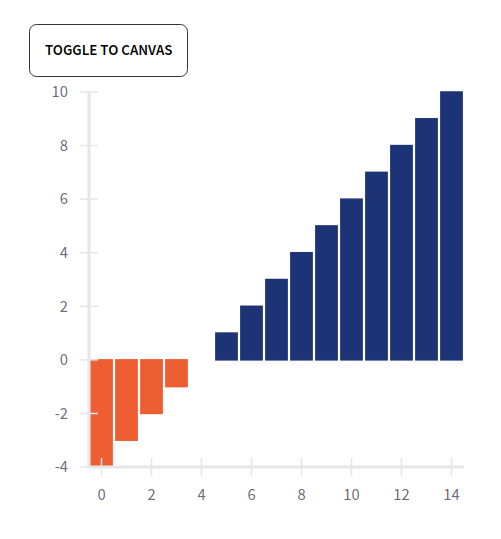
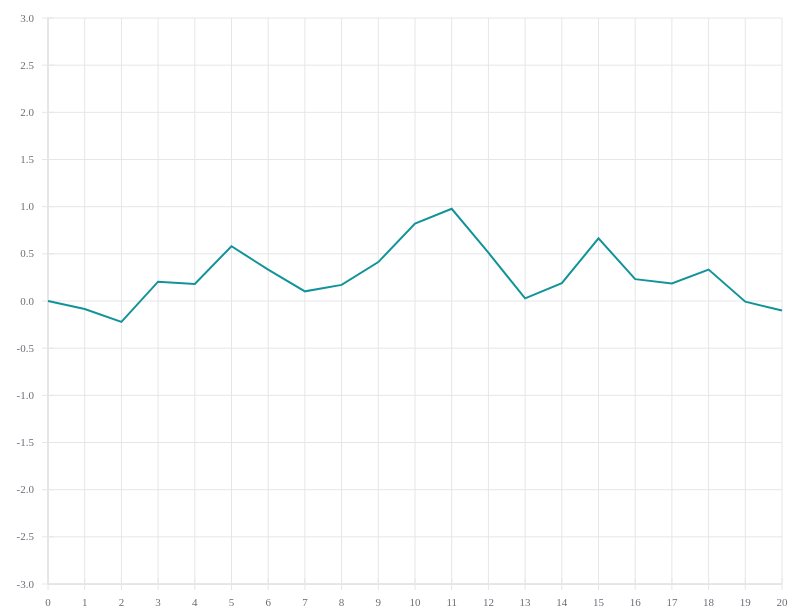
Negative numbers
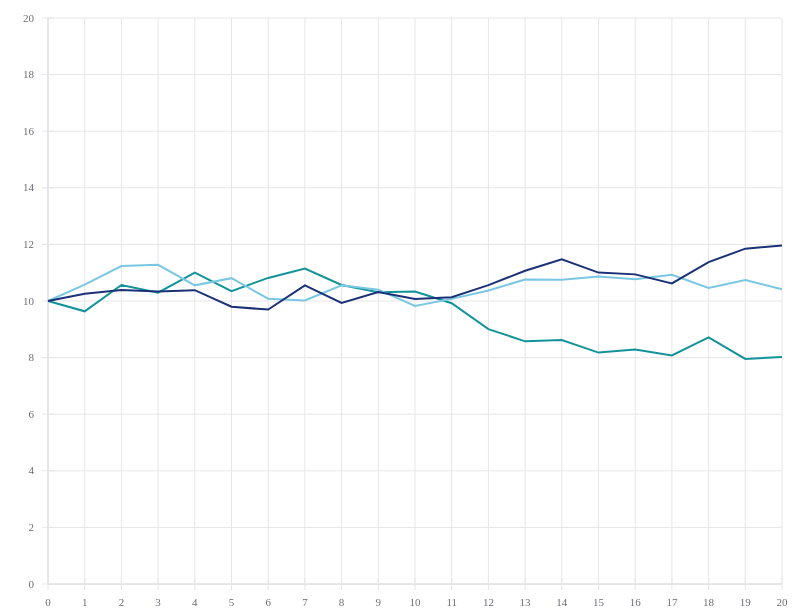
Multiple LineSeries
LineSeries styling
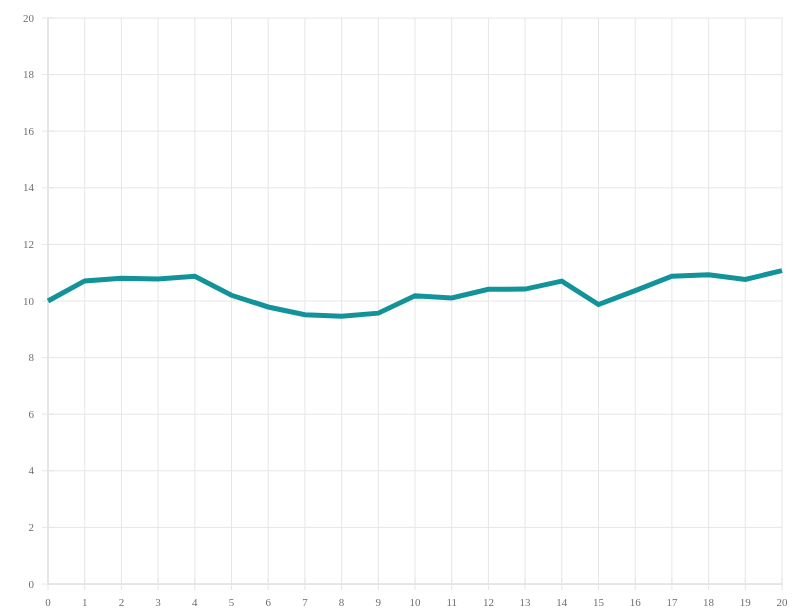
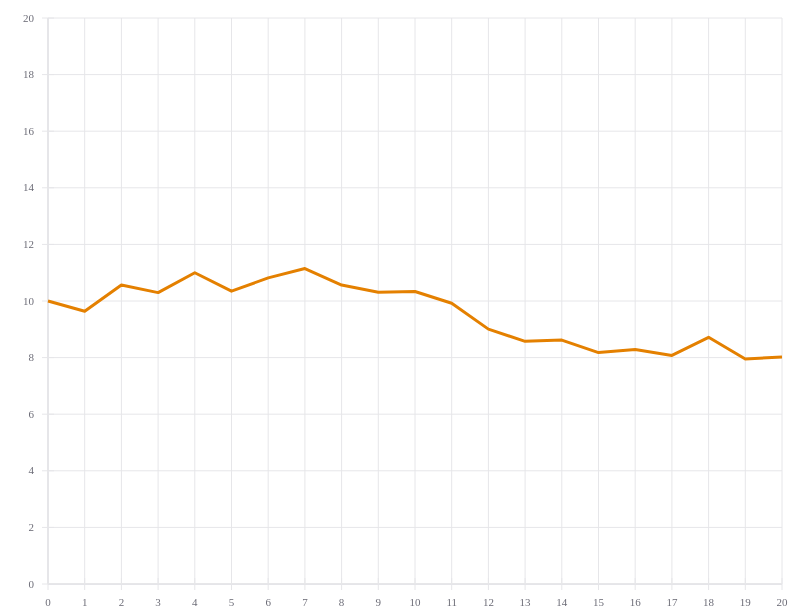
Stroke
Stroke width
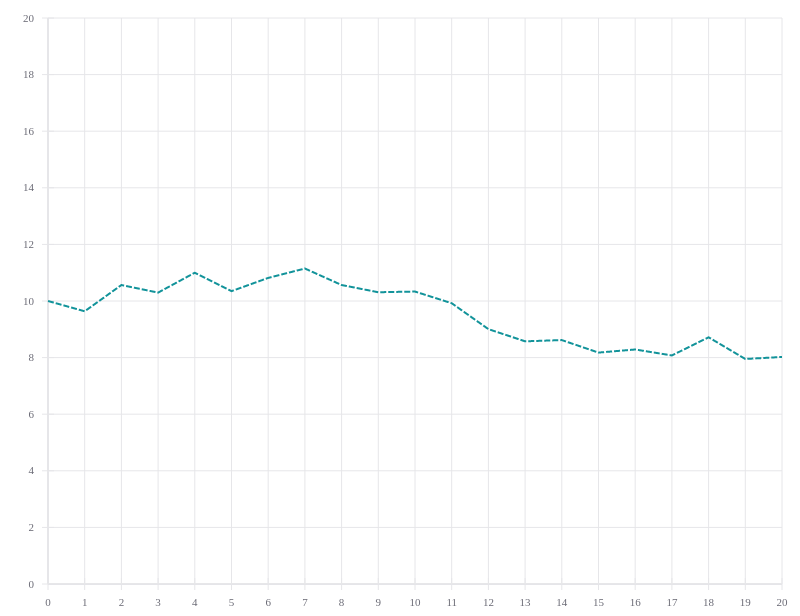
Stroke dash array
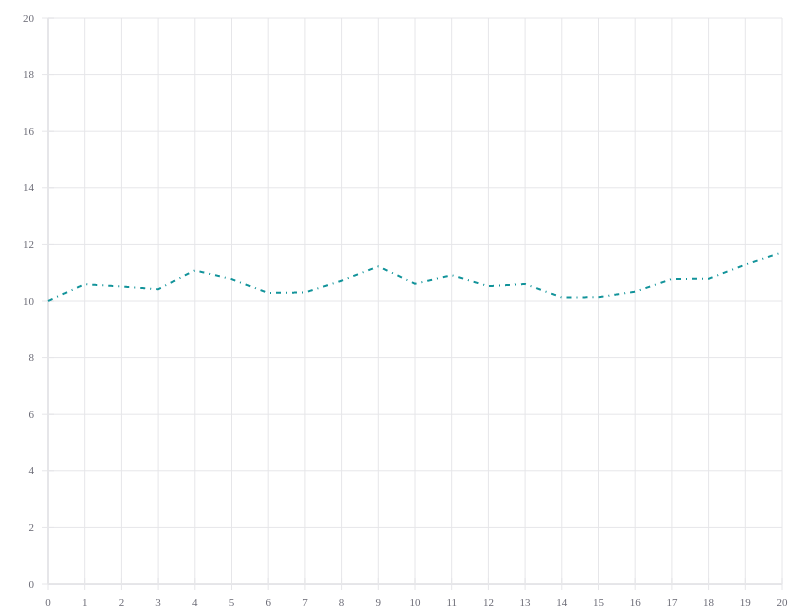
Stroke style
Opacity
Style object
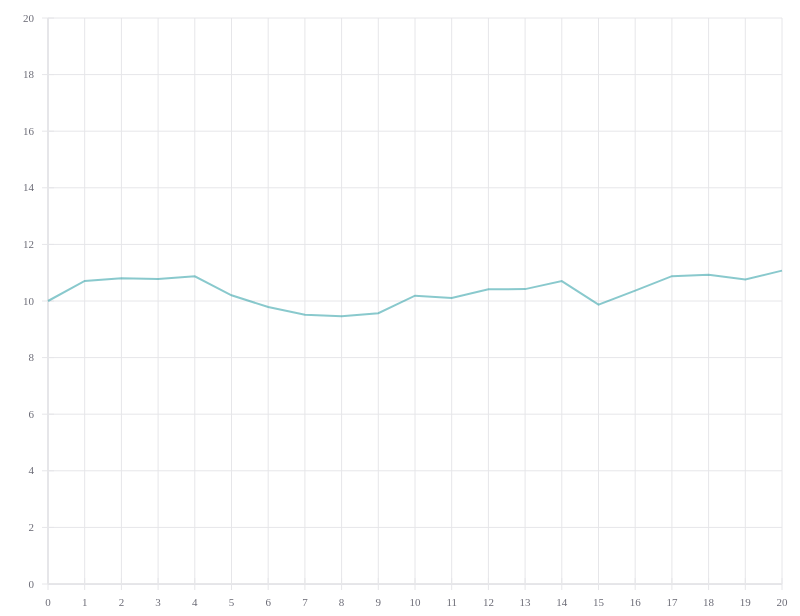
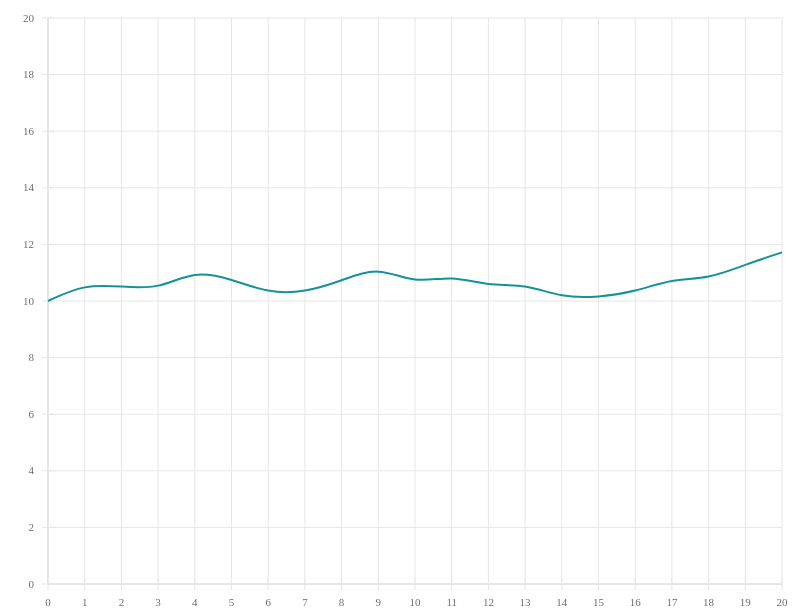
LineSeries curve
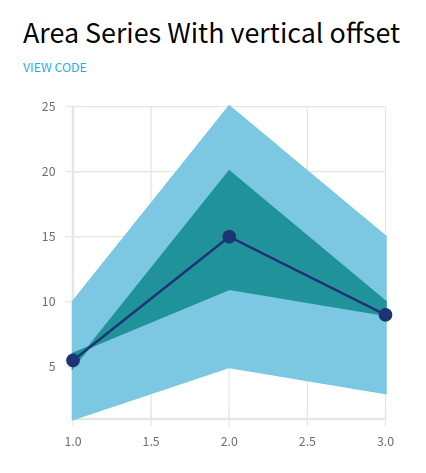
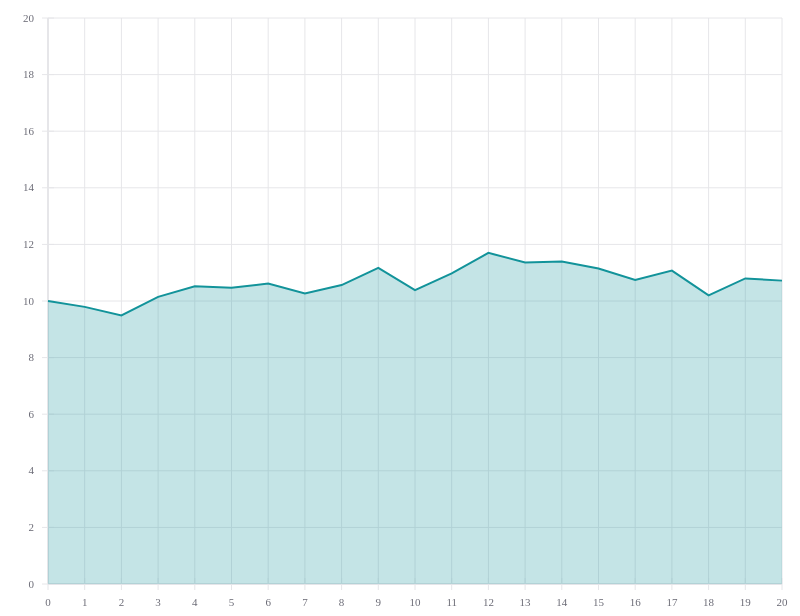
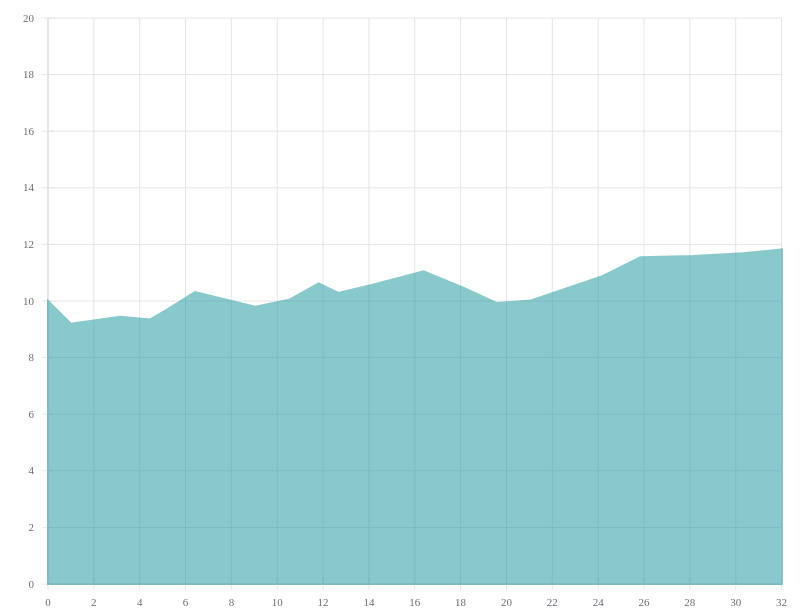
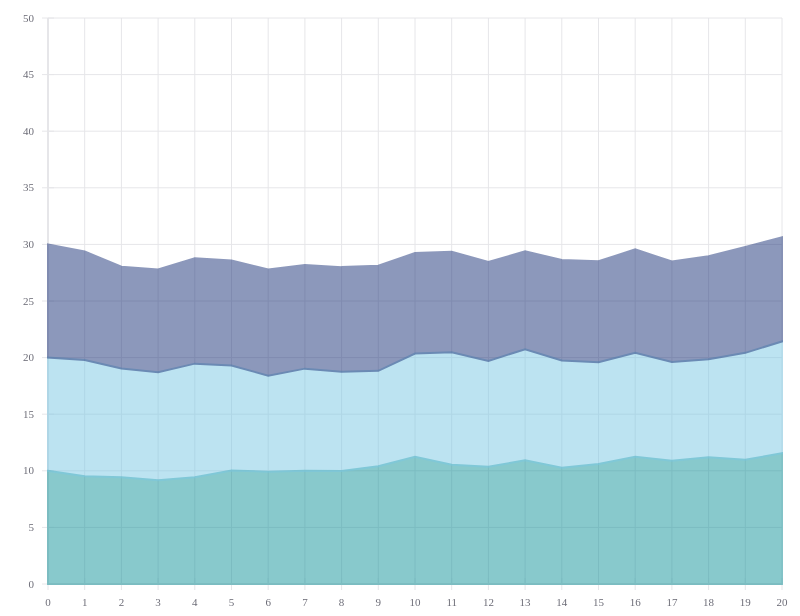
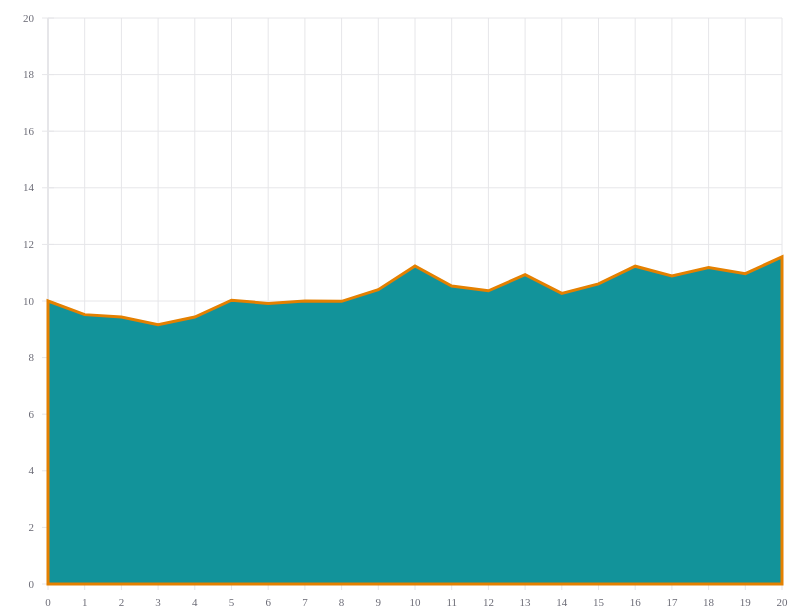
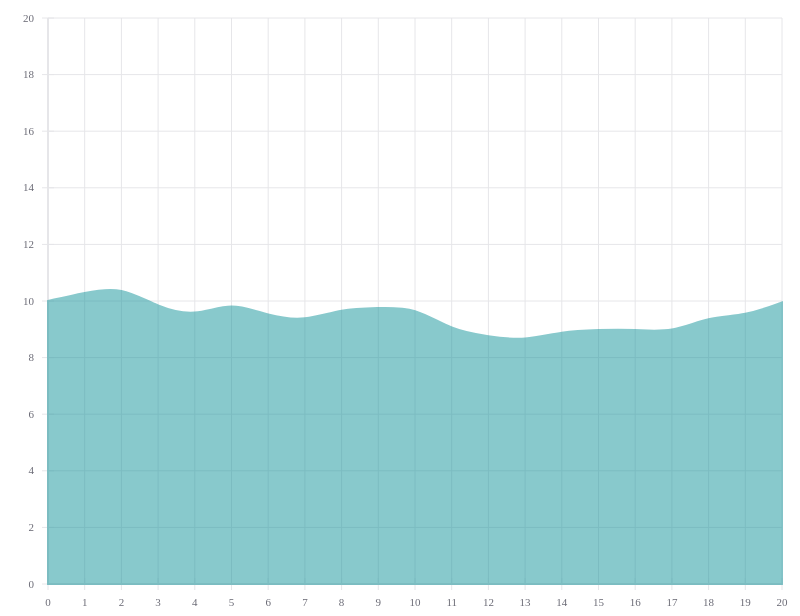
AreaSeries
AreaSeries with vertical offset
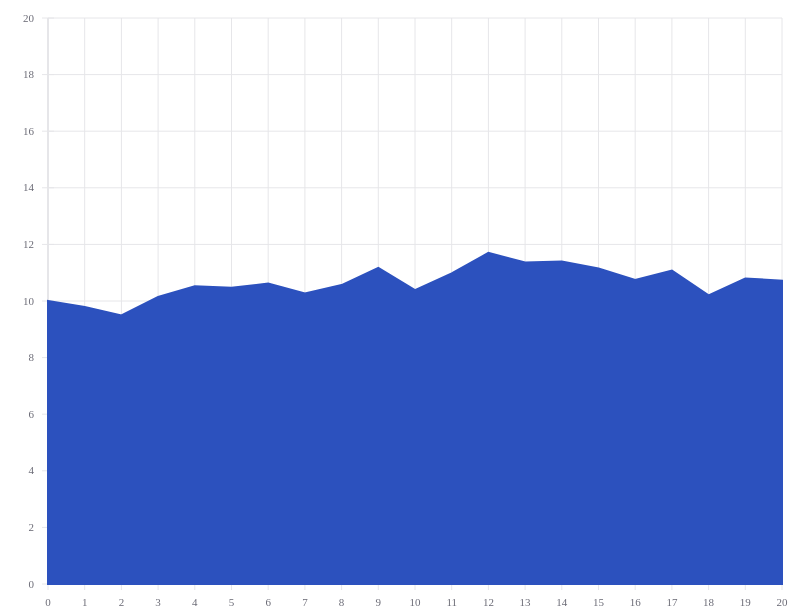
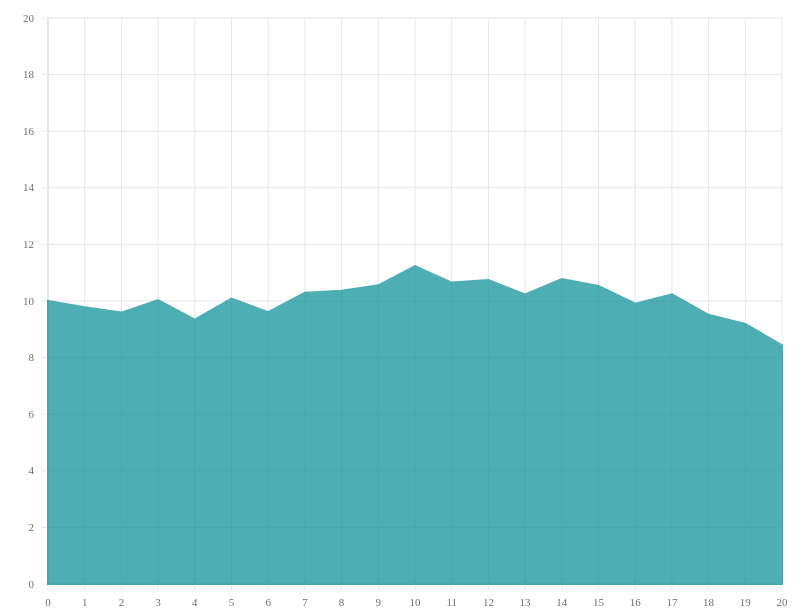
Single area chart

Single area chart & a LineSeries
Non-uniform numbers
Multiple stacked AreaSeries
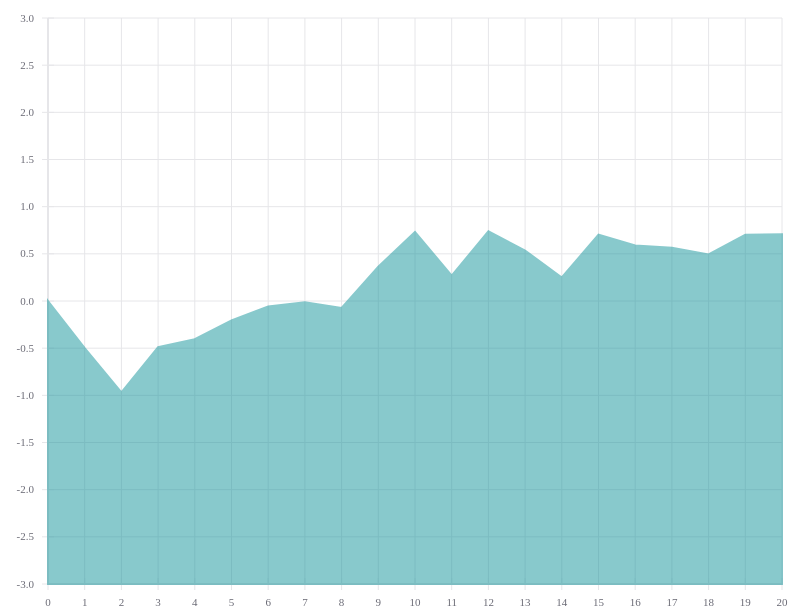
Negative numbers
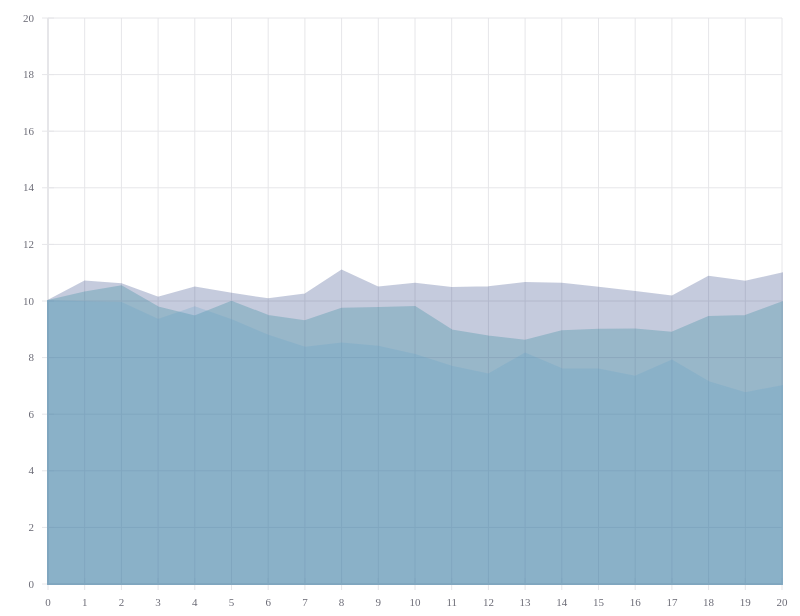
Multiple AreaSeries
AreaSeries styling
Stroke
Opacity
Style object
Curved AreaSeries
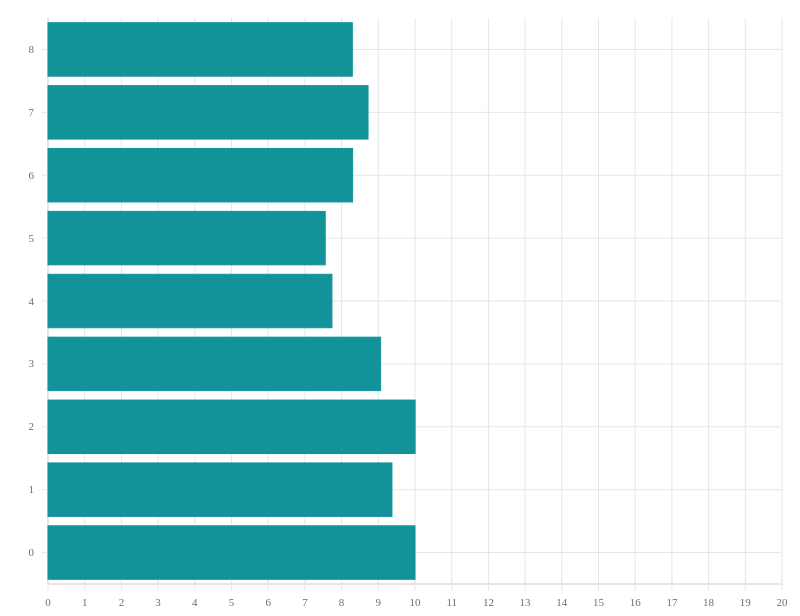
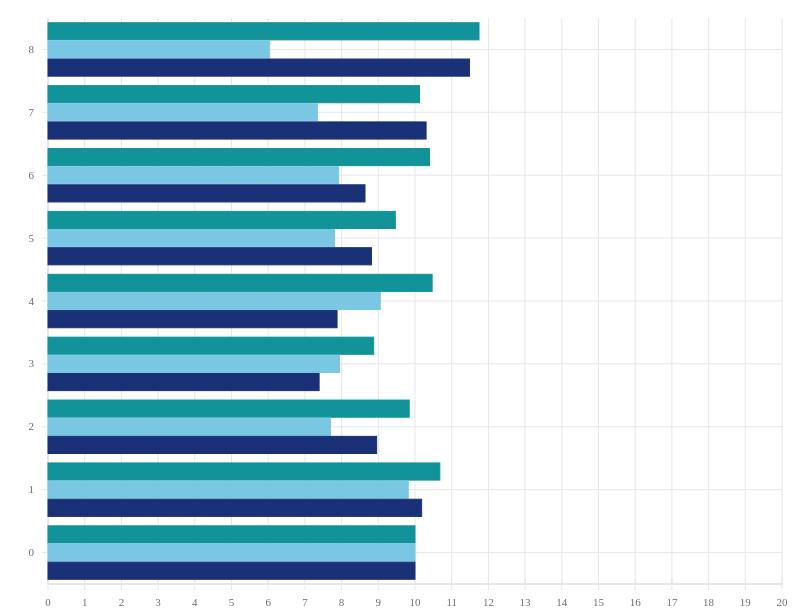
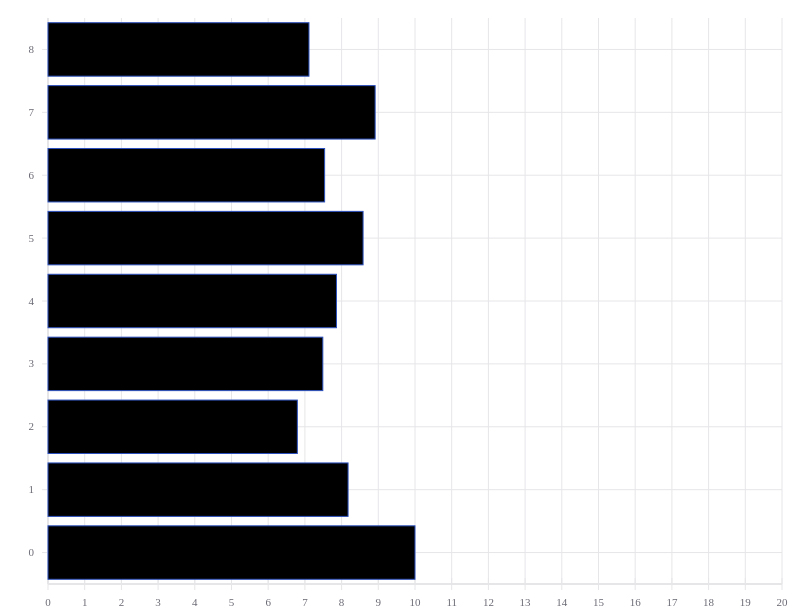
HorizontalBarSeries
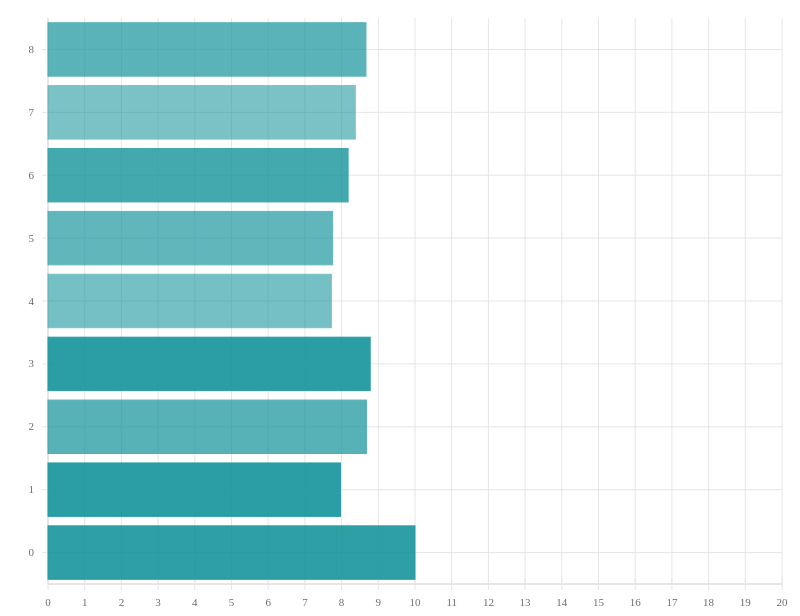
Single HorizontalBarSeries
Multiple HorizontalBarSeries, clustered
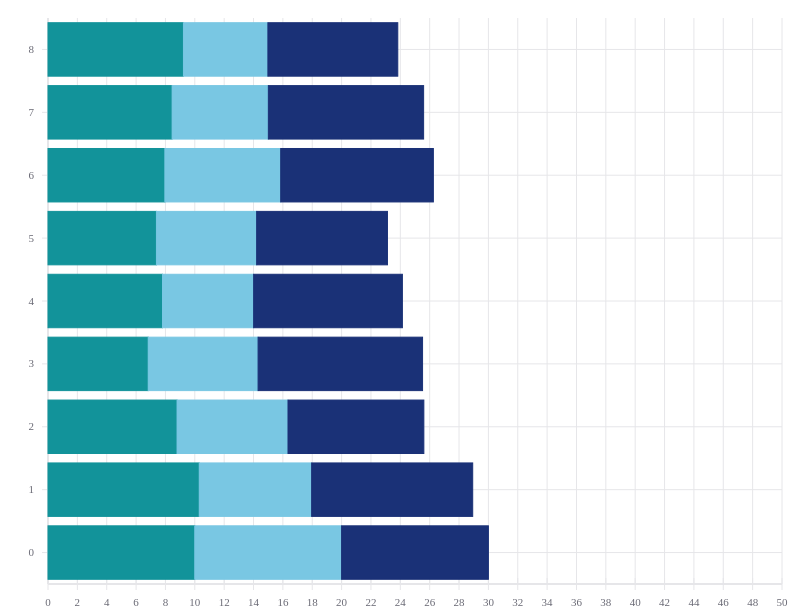
Multiple HorizontalBarSeries, stacked
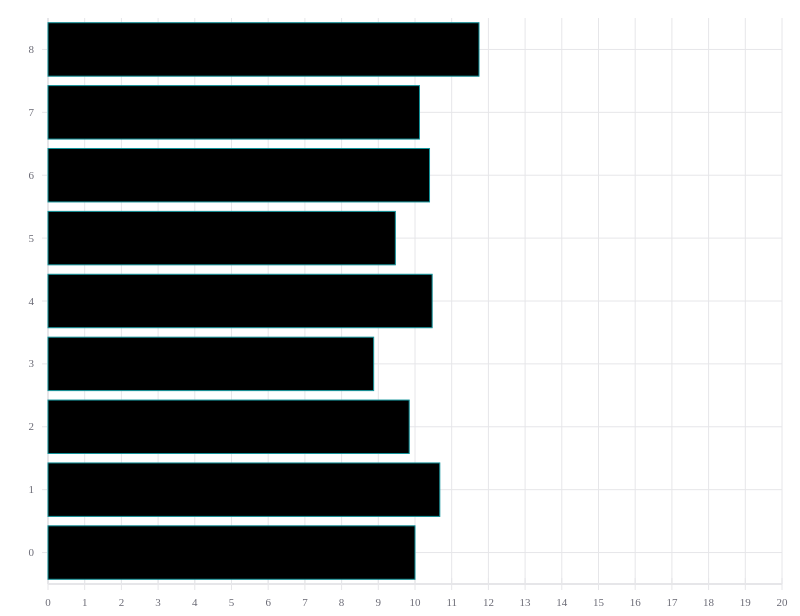
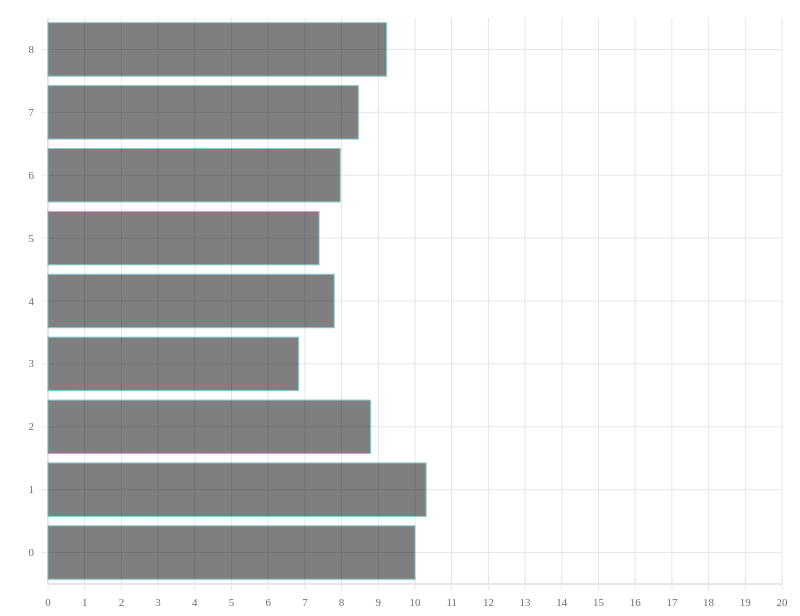
HorizontalBarSeries styling - by data point
Color
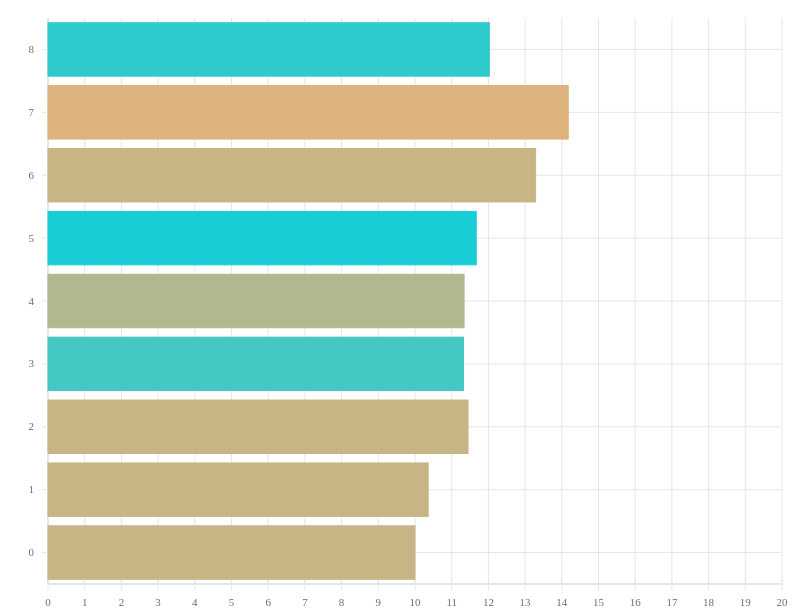
Opacity
HorizontalBarSeries styling - entire series
Style
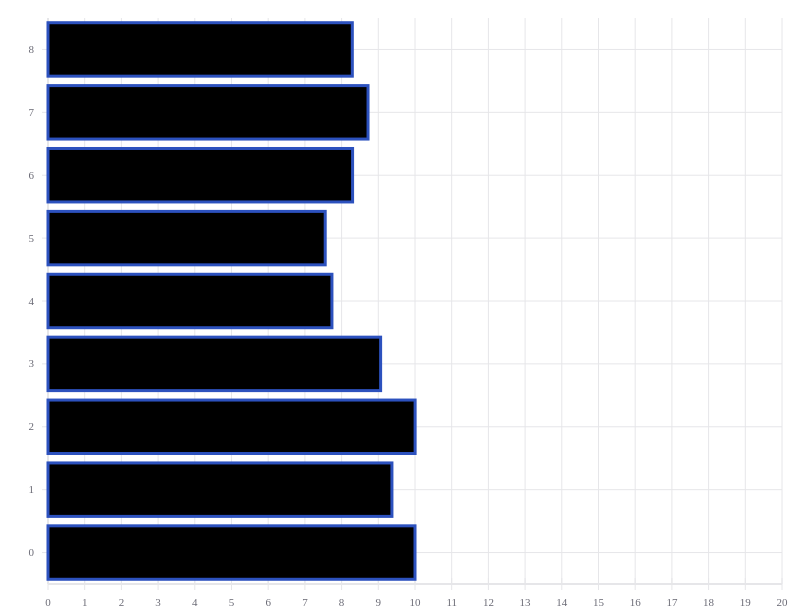
Stroke
Fill
Opacity
Legends
Searchable discrete color
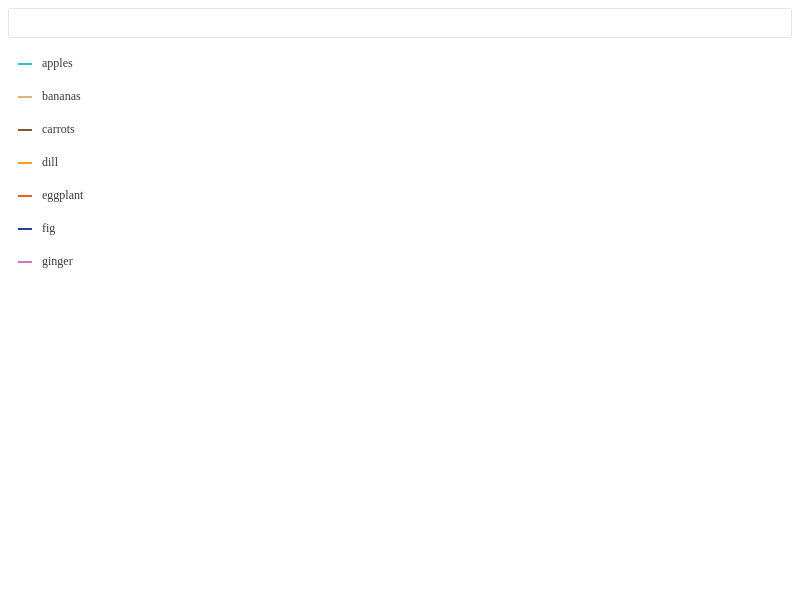
Discrete color

Continuous color
Continuous size